


![[Gamma] Scalping Please](https://ibkrcampus.com/wp-content/smush-webp/2024/04/tir-featured-8-700x394.jpg.webp "[Gamma] Scalping Please")


ETFs are relatively new financial products and have gained popularity in recent years. The ETF industry now consists of more than 2,000 funds with well over $4 trillion in assets. All ETFs are traded on major exchanges like stocks, and most are designed to track an index or asset. For many investors, ETFs provide various desirable features such as liquidity, diversification, low expense ratios, and tax efficiency.
Leveraged ETFs
Within the ETF universe, some funds are designed to replicate a constant multiple (called leverage ratio) of the daily returns of a reference index. These relatively new financial products are called leveraged ETFs (LETFs). For example, the ProShares Ultra S&P500 (SSO) is an LETF on the S&P 500 with leverage ratio β = +2, which is supposed to generate twice the daily return of the S&P 500 index.
The leverage ratio can also be negative, meaning the LETF is taking a short position in the underlying’s returns. In particular, by longing an inverse LETF, an investor can short the underlying without conducting a short-selling transaction or facing the associated margin requirement. As an example, the ProShares UltraShort S&P500 (SDS) is an LETF on the S&P 500 with β = −2.
There are also triple leveraged LETFs, such as ProShares UltraPro S&P 500 (UPRO) with β = +3, and ProShares UltraPro Short S&P 500 (SPXU) with β = −3.
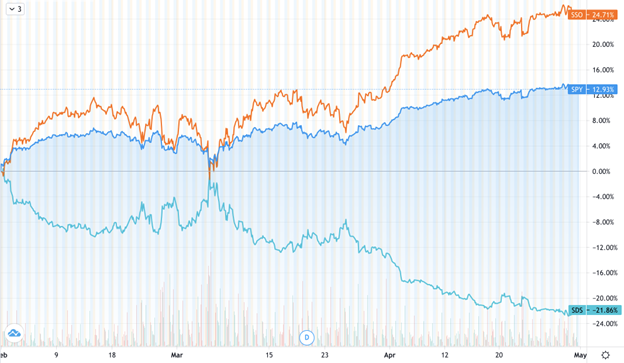
The returns of SPY (+1), and its leveraged ETFs, SSO (+2x) and SDS (-2x), from Feb 1 to May 1, 2021.
The proliferation of (L)ETFs has generated a host of new research problems. For instance, how well do these funds track their advertised benchmarks? Is there a mathematical connection between an (L)ETF and its reference index? What is the best trading strategy for tracking a given index?
In a series of papers, we investigate the tracking performance of a wide array of equity and commodity LETFs and measure their tracking errors compared to their respective benchmarks. We also construct a dynamic leveraged portfolio using short-term futures and demonstrate that this portfolio tracks the benchmark better than the market-traded LETF over a long out-of-sample period.
LETF Implied Vols
Surprisingly, even during the political climate for deleveraging in the aftermath of the 2008 Financial Crisis, markets for options on LETFs, which contribute an additional layer of leveraging, have grown, and it is important to analyze how these markets reflect volatility risk.
For (L)ETFs that track the same reference index, their associated options have very similar sources of randomness. This gives rise to the question of consistent no-arbitrage (no-free-lunch) pricing of options on ETFs and LETFs.
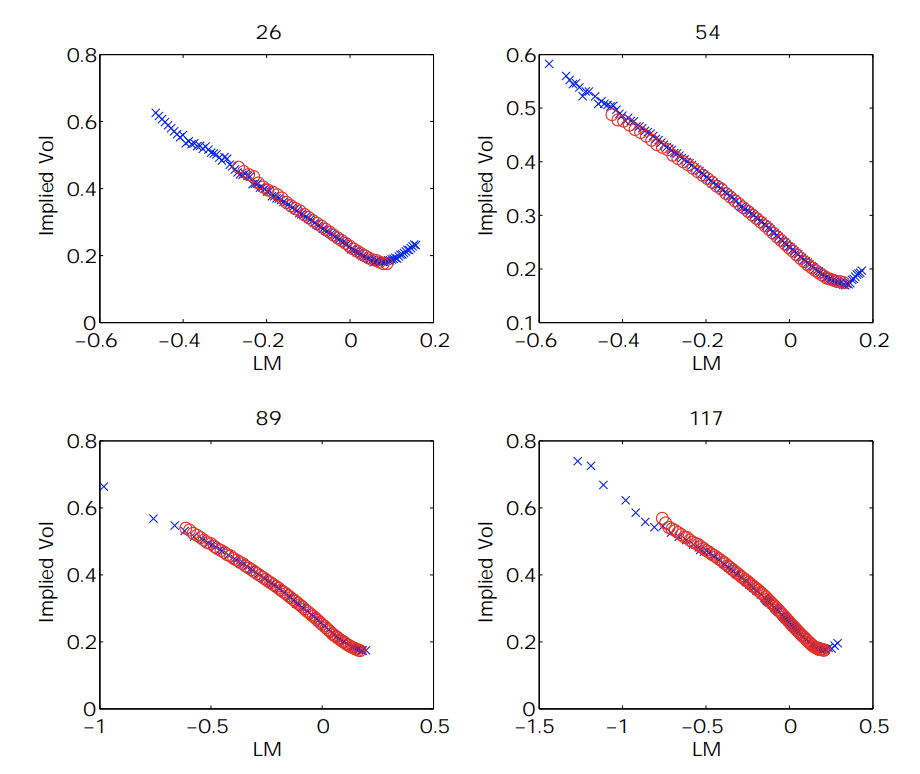
Fig. 1: SPX (blue cross) and SPY (red circles) implied volatilities on August 23, 2010, for different maturities (from 26 to 481 days) plotted against log-moneyness (LM). Source: Leung and Sircar (2015), Implied Volatility of Leveraged ETF Options [pdf], Applied Mathematical Finance 22 (2), pp.162–188.

Fig. 2: SPY (blue cross) and SSO (red circles) implied volatilities against log-moneyness (LM) for increasing maturities (26 days to 152 days). Source: Leung and Sircar (2015) – see reference below.
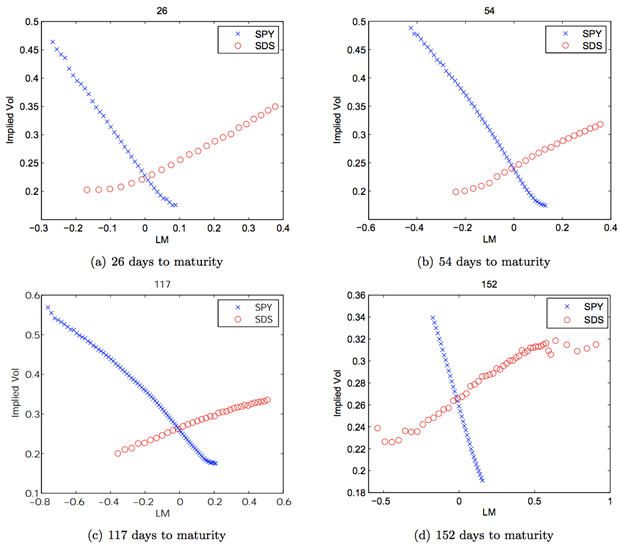
Fig. 3: SPY (blue cross) and SDS (red circles) implied volatilities against log-moneyness (LM) for increasing maturities (26 days to 152 days). Source: Leung and Sircar (2015) – see reference below.
The most salient features of the empirical implied volatilities (IVs) in Figures 1-3 are:
- the IV curve for SSO (β = 2) appears to be flatter than that for SPY (β = 1),
- the IV curve for SDS (β = -2) is upward sloping as opposed to downward sloping like those for SPY (β = 1) and SSO (β = 2).
The second observation is intuitive because higher implied volatility is commonly associated with more bearish options positions, such as OTM puts, written on the S&P 500 index. For β > 0, this corresponds to the LETF puts with strikes less than the spot LETF price. For β < 0, the bearish positions correspond to the LETF calls with strike greater than the spot LETF price, giving rise to an upward sloping implied volatility. In fact, these features are persistent across other dates, including a year-long dataset.
Implied Vol Scaling
There are mathematical connections among the implied volatilities derived from options prices on leveraged and unleveraged ETFs. We also introduce the concept of moneyness scaling and provide a new formula that links option implied volatilities between leveraged and unleveraged ETFs. This is useful not only for options trading, but also for market-making. For instance, in order to sell a far OTM LEFT call/put, then the market maker can use the corresponding implied volatility from the SPY options market to derive the price for the LETF option in question.
Under a general stochastic volatility framework, we develop analytical approximations and numerical methods to price LETF options and derive mathematical formulas for price comparison across different options markets. Our empirical evidence also suggests potential price discrepancies among ETF options with different leverage ratios.

Fig. 4: SPY (blue cross) and LETF (red circles) implied volatility curves overlap after moneyness scaling. The IVs correspond to those in Figures 1-3 with 54 days to maturity, plotted against log-moneyness of SPY options. Source: Leung and Sircar (2015) – see reference below.
Looking forward, as the market of ETFs continues to grow in terms of market capitalization and product diversity, there are plenty of new problems for future research. The availability of high-frequency trading data also permits the analysis of the intraday return patterns and arbitrage relationships of these funds compared to their reference assets.
For research discussions, reach out to me here.
References
Leung and Sircar (2015), Implied Volatility of Leveraged ETF Options [pdf], Applied Mathematical Finance, vol. 22, issue 2, pp.162–188, 2015
Leung et. al (2017), Leveraged ETF Implied Volatilities from ETF Dynamics [pdf;link], Mathematical Finance, Volume 27, Issue 4, pp.1035–1068
Leung and Santoli (2016), Leveraged Exchange-Traded Funds Price Dynamics and Options Valuation [link], Springer Briefs in Quantitative Finance, Springer
Disclosure: Interactive Brokers
Information posted on IBKR Campus that is provided by third-parties does NOT constitute a recommendation that you should contract for the services of that third party. Third-party participants who contribute to IBKR Campus are independent of Interactive Brokers and Interactive Brokers does not make any representations or warranties concerning the services offered, their past or future performance, or the accuracy of the information provided by the third party. Past performance is no guarantee of future results.
This material is from Computational Finance & Risk Management, University of Washington and is being posted with its permission. The views expressed in this material are solely those of the author and/or Computational Finance & Risk Management, University of Washington and Interactive Brokers is not endorsing or recommending any investment or trading discussed in the material. This material is not and should not be construed as an offer to buy or sell any security. It should not be construed as research or investment advice or a recommendation to buy, sell or hold any security or commodity. This material does not and is not intended to take into account the particular financial conditions, investment objectives or requirements of individual customers. Before acting on this material, you should consider whether it is suitable for your particular circumstances and, as necessary, seek professional advice.
Disclosure: Complex or Leveraged Exchange-Traded Products
Complex or Leveraged Exchange-Traded Products are complicated instruments that should only be used by sophisticated investors who fully understand the terms, investment strategy, and risks associated with the products. Learn more about the risks here: https://gdcdyn.interactivebrokers.com/Universal/servlet/Registration_v2.formSampleView?formdb=4155
Disclosure: Tax-Related Items (Circular 230 Notice)
The information in this material is provided for informational purposes only and does not constitute tax advice and cannot be used by the recipient or any other taxpayer to avoid penalties under any federal, state, local or other tax statutes or regulations, or to resolve any tax issue.
Disclosure: Margin Trading
Trading on margin is only for sophisticated investors with high risk tolerance. You may lose more than your initial investment. For additional information regarding margin loan rates, see ibkr.com/interest
Disclosure: Options Trading
Options involve risk and are not suitable for all investors. Multiple leg strategies, including spreads, will incur multiple commission charges. For more information read the "Characteristics and Risks of Standardized Options" also known as the options disclosure document (ODD) or visit ibkr.com/occ
Disclosure: Futures Trading
Futures are not suitable for all investors. The amount you may lose may be greater than your initial investment. Before trading futures, please read the CFTC Risk Disclosure. A copy and additional information are available at ibkr.com.