


Imagine a world where you can predict market movements with uncanny accuracy, where gut feelings give way to data-driven insights, and where every trade is a calculated step towards profit. This, my friend, is the alluring promise of machine learning in trading.
Among the many algorithms vying for dominance in this arena, logistic regression stands out as a versatile and beginner-friendly tool. But how exactly does it work in the world of trading?
Think of Machine learning logistic regression as a binary classifier. It analyses mountains of historical data – prices, volumes, indicators – and learns to distinguish between two distinct outcomes: up or down. Delve into the intricacies of logistic regression in machine learning for trading as we harness its capabilities to forecast stock price movements using Python.
This blog covers:
- What is logistic regression?
- Linear regression and logistic regression
- Example of logistic regression in trading
- Types of logistic regression
- Logistic regression vs linear regression
- Key assumptions while using logistic regression
- Steps to use logistic regression
- How to use logistic regression in Python for trading?
- Challenges of logistic regression
- Overcoming the challenges of logistic regression
Machine learning tasks generally bifurcate into two realms:
- The expected outcome is defined
- The expected outcome is not defined
The former characterised by input data paired with labelled outputs, is termed supervised learning. Conversely, when input data lacks labelled responses, that is, in the latter case, it’s known as unsupervised learning. Explore the ‘unsupervised learning course‘ from Quantra.
Additionally, there’s reinforcement learning, which refines models through iterative feedback to enhance performance. Now, we explore Machine Learning Logistic Regression.
What is logistic regression?
Logistic regression falls under the category of supervised learning; it measures the relationship between the categorical dependent variable and one or more independent variables by estimating probabilities using a logistic/sigmoid function.
It is primarily used for binary classification problems where the outcome can take on only two possible categorical values, often denoted as 0 and 1. Some examples are, “success” or “failure”, “spam” or “not spam”, etc.
Despite the name ‘logistic regression’, this is not used for machine learning regression problems where the task is to predict the real-valued output. It is a classification problem which is used to predict a binary outcome (1/0, -1/1, True/False) given a set of independent variables.
Linear regression and logistic regression
Logistic regression is a bit similar to linear regression, or we can say it is a generalised linear model. In linear regression, we predict a real-valued output ‘y’ based on a weighted sum of input variables.
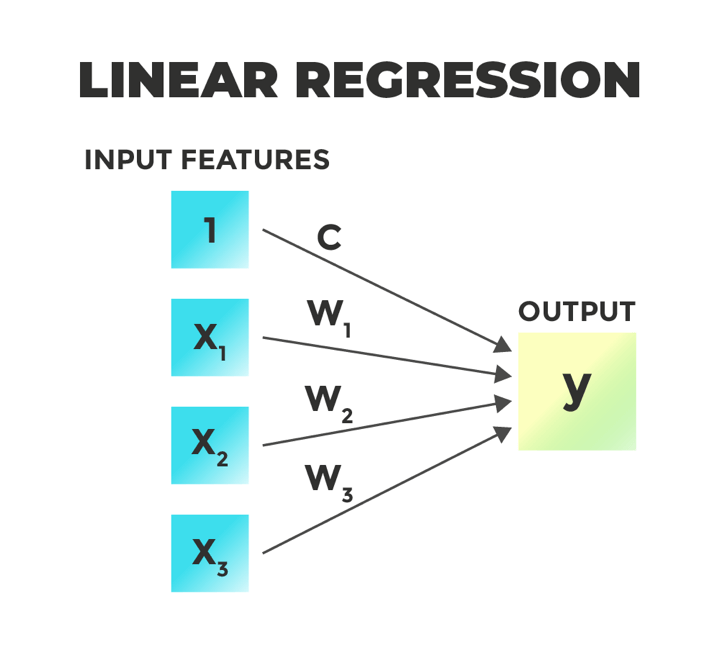
y = c + x1 ∗ w1 + x2 ∗ w2 + x3 ∗ w3 + …….. + xn ∗ wn
The aim of linear regression is to estimate values for the model coefficients c, w1, w2, w3 ….wn and fit the training data with minimal squared error and predict the output y.
Machine learning Logistic regression does the same thing but with one addition. The logistic regression model computes a weighted sum of the input variables similar to the linear regression, but it runs the result through a special non-linear function, the logistic function or sigmoid function to produce the output y. Here, the output is binary or in the form of 0/1 or -1/1.
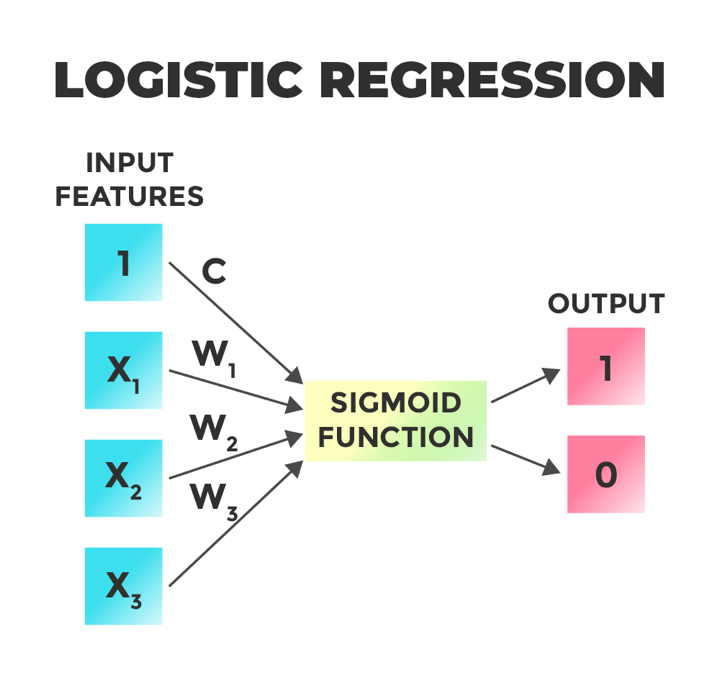
y = logistic(c + x1 ∗ w1 + x2 ∗ w2 + x3 ∗ w3 + …….. + xn ∗ wn)
y=1/1 + e[−(c + x1 ∗ w1 + x2 ∗ w2 + x3 ∗ w3 + …….. + xn ∗ wn)]
The sigmoid/logistic function is given by the following equation.
y = 1 / 1+ e-x
As you can see in the graph, it is an S-shaped curve that gets closer to 1 as the value of the input variable increases above 0 and gets closer to 0 as the input variable decreases below 0.
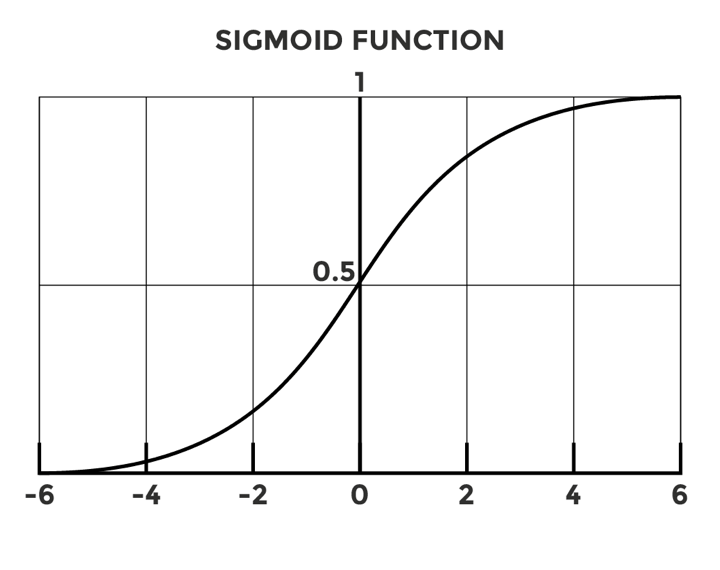
In the context of Machine learning logistic regression, the decision boundary is commonly set at 0.5, meaning that if the predicted probability is greater than 0.5, the outcome is classified as 1 (positive), and if it is less than 0.5, the outcome is classified as 0 (negative).
Now, let us consider the task of predicting the stock price movement. If tomorrow’s closing price is higher than today’s closing price, then we will buy the stock (1), else we will sell it (-1). If the output is 0.7, then we can say that there is a 70% chance that tomorrow’s closing price is higher than today’s closing price and classify it as 1.
Author: Chainika Thakar (Originally written By Vibhu Singh)
Stay tuned for Part II to learn about logistic regression in trading.
Originally posted on QuantInsti blog.
Disclosure: Interactive Brokers
Information posted on IBKR Campus that is provided by third-parties does NOT constitute a recommendation that you should contract for the services of that third party. Third-party participants who contribute to IBKR Campus are independent of Interactive Brokers and Interactive Brokers does not make any representations or warranties concerning the services offered, their past or future performance, or the accuracy of the information provided by the third party. Past performance is no guarantee of future results.
This material is from QuantInsti and is being posted with its permission. The views expressed in this material are solely those of the author and/or QuantInsti and Interactive Brokers is not endorsing or recommending any investment or trading discussed in the material. This material is not and should not be construed as an offer to buy or sell any security. It should not be construed as research or investment advice or a recommendation to buy, sell or hold any security or commodity. This material does not and is not intended to take into account the particular financial conditions, investment objectives or requirements of individual customers. Before acting on this material, you should consider whether it is suitable for your particular circumstances and, as necessary, seek professional advice.
Join The Conversation
If you have a general question, it may already be covered in our FAQs. If you have an account-specific question or concern, please reach out to Client Services.