


![[Gamma] Scalping Please](https://ibkrcampus.com/wp-content/smush-webp/2024/04/tir-featured-8-700x394.jpg.webp "[Gamma] Scalping Please")


The post Momentum, Quality, and R Code first appeared on the Alpha Architect Blog.
Momentum Research with R
In a previous post, we covered the steps for implementing a basic momentum investing strategy with R code. We covered quite a bit of code in that post and it’s worth a look if momentum investing or algorithmic (fancy word for if/else) logic is new to you (if R code is brand new, a good place to start is this post on calculating prices and returns with R). Today, we’re going to tackle a slightly different momentum project and focus on the idea of quality.
Visit Alpha Architect website to read more on the two methodologies referenced in this article: Grinblatt and Moskowitz 2004 and the measure of quality covered here.
Building Grinblatt and Moskowitz Momentum
Let’s get to the R code, starting with methodology 1, wherein we determine whether at least 8 of the past 12 months showed a positive return. We’re going to do things a bit differently from last time where we examined a momentum strategy that used SPY and EFA. Today, we’ll work with SPY, XLF and XLE and try to compare the quality of their momentum signals. That means we’ll need to calculate their monthly returns and their past 12-months’ returns.
We’ll import daily prices, convert to monthly returns, and then create a new column called skip_mon_return that is the one month lagged returns. We do that because the most recent previous month might be a bit noisy or volatile, and leaves us at the mercy of the so-called short term reversal effect.
Let’s start by loading our packages for today,
library(tidyverse)
 library(highcharter)
 library(tibbletime)
 library(tidyquant)
 library(timetk)
 library(riingo)
 riingo_set_token("your token here")
Then we’ll import price data from tiingo, using the R package called riingo.
symbols <-
   c("SPY", "XLF", "XLE")
prices_daily <-    symbols %>%
   riingo_prices(.,
                 start_date = "2000-01-01",
                 end_date = "2018-12-31") %>%
   mutate(date = ymd(date)) %>%
   group_by(ticker)
Now let’s convert to monthly prices.
prices_monthly <- prices_daily %>%
   tq_transmute(select = adjClose,
                         mutate_fun = to.monthly,
                         indexAt = "lastof")
And finally, convert from monthly prices to monthly returns. We’ll also lag our returns and place the lagged values in a new column called ‘skip_mon_return’.
prices_monthly %>%
   mutate(mon_return =  ((adjClose / lag(adjClose)) - 1),
          skip_mon_return = lag(mon_return)) %>%
   head()
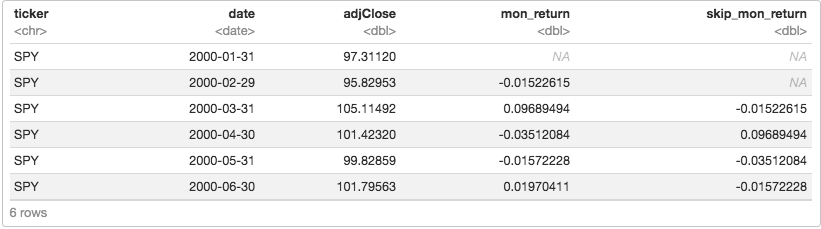
Have a quick peek at that data and notice how the skip_mon_return column is ignoring the previous month. For example, on March 31, 2001, we are not going to consider what happened from the end of February to the end of March, because there could be some weird stuff going on that’s isn’t going to last more than a few days. Instead, we’ll look back to what happened during February as our first data point.
In the next installment Jonathan Regenstein will show us how to calculate the 12-months cumulative return, but he’ll lag that as well with lag(adjClose) / lag(adjClose, 12) - 1).
Disclosure: Alpha Architect
The views and opinions expressed herein are those of the author and do not necessarily reflect the views of Alpha Architect, its affiliates or its employees. Our full disclosures are available here. Definitions of common statistics used in our analysis are available here (towards the bottom).
This site provides NO information on our value ETFs or our momentum ETFs. Please refer to this site.
Disclosure: Interactive Brokers
Information posted on IBKR Campus that is provided by third-parties does NOT constitute a recommendation that you should contract for the services of that third party. Third-party participants who contribute to IBKR Campus are independent of Interactive Brokers and Interactive Brokers does not make any representations or warranties concerning the services offered, their past or future performance, or the accuracy of the information provided by the third party. Past performance is no guarantee of future results.
This material is from Alpha Architect and is being posted with its permission. The views expressed in this material are solely those of the author and/or Alpha Architect and Interactive Brokers is not endorsing or recommending any investment or trading discussed in the material. This material is not and should not be construed as an offer to buy or sell any security. It should not be construed as research or investment advice or a recommendation to buy, sell or hold any security or commodity. This material does not and is not intended to take into account the particular financial conditions, investment objectives or requirements of individual customers. Before acting on this material, you should consider whether it is suitable for your particular circumstances and, as necessary, seek professional advice.
Disclosure: Displaying Symbols on Video
Any stock, options or futures symbols displayed are for illustrative purposes only and are not intended to portray recommendations.