


First edition.
Roberto Delgado Castro
Data Professional and Compliance Officer
robdelcas at gmail.com
Introduction
Finance professionals worldwide face every day demanding challenges in financial analysis.
Customers (private sector) and users (public sector) demand more accurate financial analysis, especially to improve the market’s competitive position. This fact forces analysts to innovate using more complex tools to accomplish such needs.
At this point, data science, specifically the usage of R (statistical programming language), could be a fantastic partner to improve the quality and scope of financial analysis.
Typically, when performing a quantitative analysis of an organization, the main inputs are its financial statements. Therefore, each account would be used to calculate some key metrics or indicators to build a determined scenario based on the interpretation of each of them. At the end of the exercise, a “picture” will be displayed showing the real financial situation, and, obviously, some crucial recommendations will be attached in order to improve the weaknesses detected. In this specific case, R could function as a wonderful tool to automate such tasks in order to improve the quality of the results (outputs).
This kind of analysis using R fits perfectly to evaluate the performance of public trusts.
Within the last seven years, due to my position as a Data Professional and Compliance Officer of an important public-financial institution in Costa Rica, I have been working on developing supervision models of large trusts that have received public resources from Costa Rica’s government. Hence, I have developed a Model where R plays the starring role. The inputs: trust’s official financial statements. Processing stage: automatic model in R. Outputs: financial score for each trust.
During the third week of May 2023, I presented this model at the R/Finance 2023 Conference, hosted by the International Center for Futures and Derivatives (ICFD), part of the College of Business of the University of Illinois at Chicago (UIC). It was a huge honor to have the chance to share my research project with the world’s brightest minds in applied finance in R.
Theoretical framework
“We can say now that the Trust is one of the most rare and exotic forms of the legal system of all times, and due to that it has an enormous success in Anglican countries, as well as in countries with civilist tradition in Latin America; the authors focus in the obligation that is being formalised in the moment of applying the property of a good in the benefit of another person”. (Bello, Knoll, 2011).
At this point, the Trust Contract materialises itself when a physical person or a legal entity transmits the property of a good or asset to a fiduciary institution, to let it take care of it and manage it according to the aims determined in the Contract.
Considering that, once constituted the Trust by means of the formalization of the respective Contract, it generates an Autonomous Patrimony. The components of a Trust are:
- Trustor: the one who transmits the good. It can be a physical person or a legal entity. It is the person or institution that creates the Trust.
- Fiduciary: the one that manages the goods. It is the person or institution that receives the goods and manages them.
- Trustee are the beneficiaries of the goods transmitted to the Fiduciary. They are the persons or institutions that receive the benefits of the Trust.
- Autonomous Patrimony is the Patrimony that is generated with the goods transmitted by the Trustor. Such goods are enclosed in the Autonomous Patrimony.
The origins of the Trust as a legal instrument go back to ancient Rome and mostly materialized in the trust that a transmitter of goods would deliver the goods to the purchaser. Once these kinds of transactions evolved in their levels of complexity, the need to regulate those practices arose; that is the reason why the first developments of a concept known as Fiducia Cum Amico appeared, the oldest of those figures, which reflected the transfer of ownership to a third party for administration during a specified period of time.
In Latin America, the Trust began its evolution as a legal instrument in the XIX Century, mainly in Argentina, where lots of property-transfer transactions were done using such instruments.
In Costa Rica, the Trust is regulated by the “Codigo de Comercio” (Commercial Act), which, in article 633, mentions its definition: “the Trustor transfers to the Fiduciary the property of goods or rights; the Trustor is obligated to use them in legal terms according to its Constitutive Contract”. Also, in 1964, the “Codigo de Comercio” (Commercial Act), includes the Trust as a figure of the Commercial Contract itself.
The Public Trust originated when the State or Government acts as Trustor, and transmits to the Fiduciary the administration of public goods or assets; the general characteristic of the instrument is a legal objective of public interest. The attribution of using the instrument of the Legal Trust is given by article 14 of the “Ley de Administración Financiera de la República y Presupuestos Públicos”, (Financial Administration and Public Budgets Act).
“The Trust is an instrument that has been used for years in legal research. Such an instrument is widely useful in managing a wide variety of projects; in the specific case of the public sector, it is no exception. The predominance of these instruments is related to the possibility of adapting them to a wide variety of needs. Due to that, this instrument has had remarkable usage in the fields of private law, finance and commerce. Nevertheless, the immersion of the Trust in the Public Sector is relatively new in Costa Rica, so there have been few projects executed using this instrument, and not all public institutions recognize it or have the capacity of using it as well”. (Vargas Lepe, 2014).
“The assets represent all the resources and properties that an organization uses to develop its operations: cash (liquidity), pieces of land, facilities, buildings, machinery and accounts payable. The liabilities are made of all the obligations that an organization owes to third parties: debts, taxes and loans. The Patrimony represents the right that the owners possess in the organization’s assets; so, it is the difference between what the company has and what the company owes, and shows the results to the owners”. (Diaz Moreno, 2006).
The liquidity is considered as the cash and short-term assets portfolios that can be converted to cash in a simple way. “The Current Assets are goods or property rights of an organization, that could be converted to cash in a short term”. (Diaz Moreno, 2006).
“The profitability measures the effectiveness of the administration related to the yield generated by sales and investments”. (David, 2008).
The Long Term Investments, usually, are investments in portfolios whose maturity is longer than a year and their conversion into cash is not as simple as the short-term portfolios. These kinds are classified as Non Current Assets.
The Credit Portfolio of a financial entity includes all loans that have been formalized with clients, who are active in the market, for whom the institution must apply a timely collection process to return the correspondent payments on a punctual basis, in order to minimize the appearance of arrears and defaulting operations. In general terms, the Credit Portfolio is managed by payments-delay-ranges report of every single operation formalized. The Credit Portfolio constitutes an asset for the financial entity.
The sustainability of a Trust is its capacity to keep a positive financial balance over time, especially, on a long-term basis (more than 12 months). In this point, the Trust should be capable of producing profits and reflecting them in the financial statements.
Trust’s financial statements: general structure of data display
Each financial statement, Statement of Income and Balance Sheet, typically, has the following structure at the moment of displaying their results:
| Account | Balance |
That means those financial reports have two columns: the name of the account and the correspondent balance. Thus, when an analyst performs a study from that data, a simple two-column table may be manipulated in order to come up with calculations of metrics.
Pivot tables in R: the necessity to Tidyr the data
Due to the fact that a two-column table (account and balance) is used as the data-source to execute the calculations of the metrics in R, it is necessary to Tidyr such a table using the Pivot-Table-function.
Initial data display
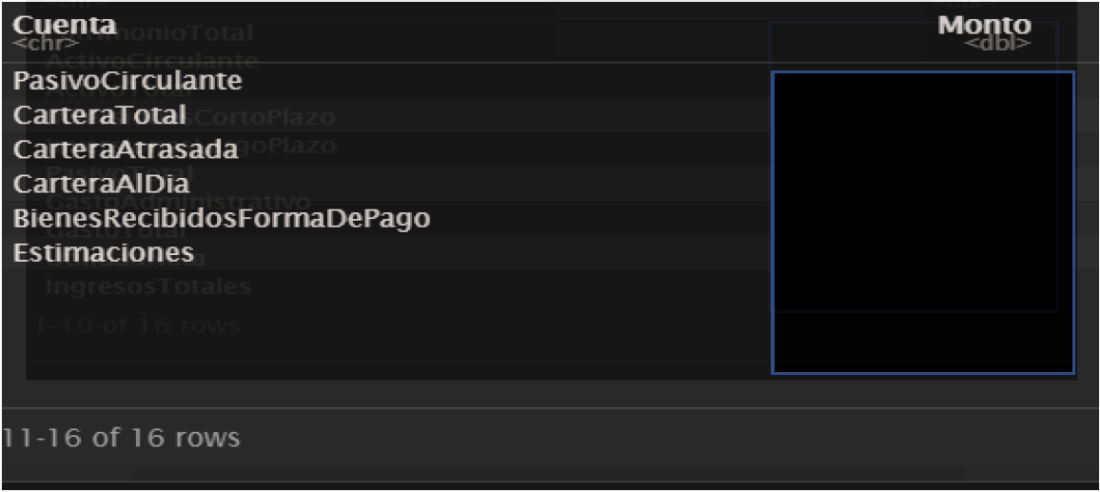
In the initial stage, once the source-data-file (CSV format) has been already uploaded in R using ReadR package, the data can be displayed in the following dataframe in RStudio:
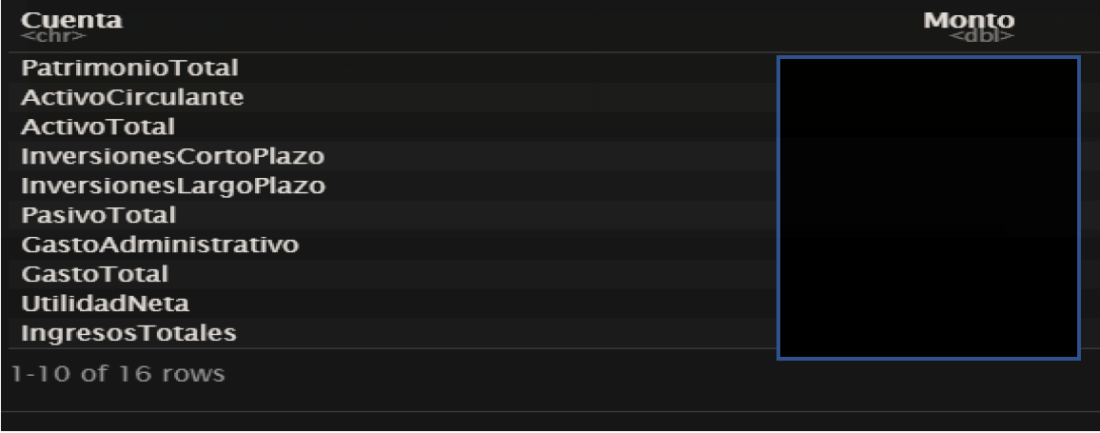
Tidyr source-table to develop calculations
The way data is displayed in the detailed dataframe in the initial stage, is not the best manner to develop the proper calculations of each metric, because such dataframe displays only two variables (Cuenta, Monto), and R does not recognize every single account as a separate variable.
For example, to calculate the Patrimonial Coverage Metric (PCM), the balances of the accounts of the Total Loan Portfolio and Patrimony must be divided. The way data was displayed in the detailed dataframe is inconvenient to perform such a calculation; it generates an error because R does not recognize such accounts as variables.
In order to let R perform adequately the mentioned calculations, the Pivot_Wider function should be used, in order to increase the number of columns and decrease the number of rows. The following code was utilized to do so:
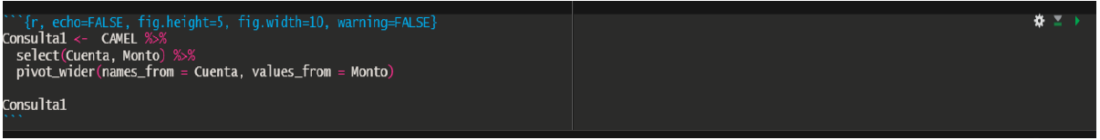
Once that code was executed, R displayed the following dataframe:


As shown, a new dataframe with 1 row and 16 columns was displayed. This new one is different from the old one displayed in the Initial Stage (16 rows and 2 columns).
Metric calculations
Once the source-data has been already ordered through the Pivot Table function, each metric calculation can be performed, because now R considers each account as a separate variable. Each metric is displayed in a new column through mutate function.
The code executed to perform the calculations is as follows:
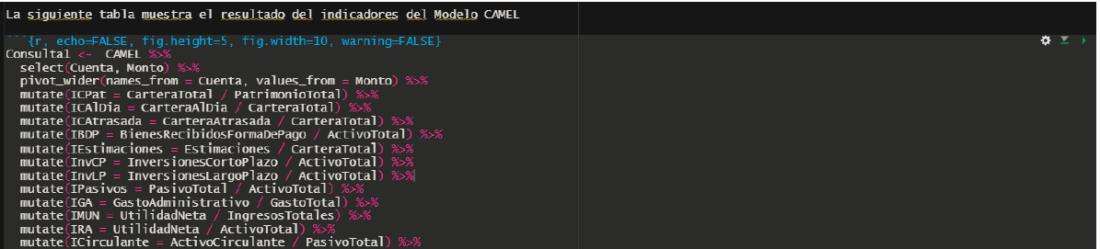
The result of the metrics is shown as follows:

Metric evaluation: conditional algorithms with If_Else function
Once the metrics have been calculated, an individual evaluation of each quantitative result can be performed using If_else function.
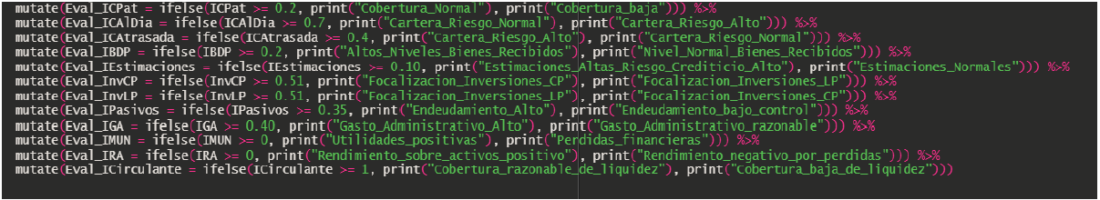
For each result for each metric, through If_else function, a conditional algorithm is inserted to let R evaluate the previous quantitative result obtained. Depending on each result and the pre-determined condition, a specific evaluation would be displayed. The code used is as follows:
The results of the evaluation are shown as follows:


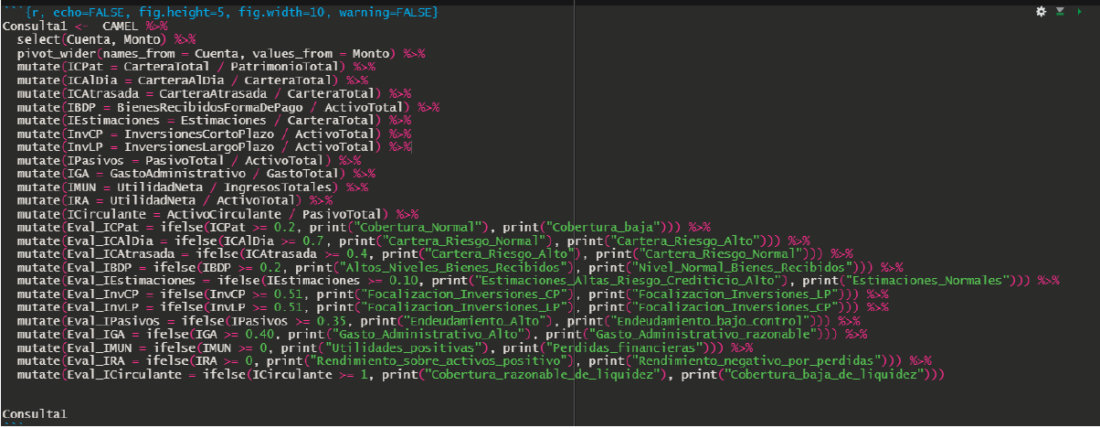
All in one chunk
The last mentioned stages in R were performed in one chunk: pivot_table function, metric calculations and results evaluation. This fact brings the advantage to manage the code in a one-single chunk and, consequently, its results are shown in a single dataframe.
Conclusions and recommendations: Financial point of view
The application of the Model, for each trust, from a financial point of view, allows the capacity to detect anomalies in the following areas:
- Tendencies in the growth or decrease of the Patrimony, element that is related to the increase or reduction of the net financial value of each Trust.
- Levels of patrimonial coverage with respect to the Credit Portfolio.
- Levels of current and arrears of Credit Portfolio operations.
- Levels of the total value of assets received in the method of payment due to defaulting credit operations.
- Liquidity management (short-term investments portfolio) and management of long-term investments portfolio.
- Levels of debt.
- Management of Administrative Expenses with respect to Total Expenses.
- Levels of profitability.
- Yield of assets, especially, productive assets.
- Levels of Non Current Assets with respect to Short-Term Liabilities.
The mentioned elements bring a general view of the financial situation of each Trust up to a certain date. Additionally, if a result that could be subject to improvement, it is possible to recommend corrective adjustments in order to guarantee its sustainability.
Conclusions and recommendations: Public policy point of view
The application of the Model, for each trust, from a public policy point of view, allows the capacity to:
- Develop an automatic-innovative tool to supervise massive public trusts, in order to detect and improve, in a timely manner, financial and operative anomalies.
- Ensure, in a high percentage, financial sustainability of the supervised trusts.
Advantages of its application for each Trust
The advantages of the application of the Model for each trust, in general terms, are as follows:
- Strengthens the follow-up of the Credit Portfolio, in order to avoid potential-dangerous increases of arrears and its correspondent growth of the amount of money destined for Collection Estimates.
- Improves the administrative tasks applied to convert properties received as a manner of payment of defaulting credit operations into cash, in order to strengthen the Trust’s liquidity.
- Refines and updates investment risk policies (short and long-term).
- Explains deeply certain expense items for which it is necessary to add a clearer justification.
- Focalizes the outreach in the strengthening of liquidity as a coverage tool facing short-term financial obligations.
- In cases for which losses could appear, each Trust must justify the reasons why they appeared, as well as the actions to execute in order to revert them in a short-term.
References
Paola Vargas Lepe. (2014). El Control Previo en el Fideicomiso con fondos públicos. Costa Rica: Universidad de Costa Rica.
Susy Inés Bello Knoll. (2011). Fideicomiso Público. España: Universidad de Salamanca.
Hernando Díaz Moreno. (2006). Contabilidad General. Mexico: Pearson Education.
David, Fred R. (2008). Conceptos de Administración Estratégica. Mexico: Pearson Educación.
Disclosure: Interactive Brokers
Information posted on IBKR Campus that is provided by third-parties does NOT constitute a recommendation that you should contract for the services of that third party. Third-party participants who contribute to IBKR Campus are independent of Interactive Brokers and Interactive Brokers does not make any representations or warranties concerning the services offered, their past or future performance, or the accuracy of the information provided by the third party. Past performance is no guarantee of future results.
This material is from Roberto Delgado Castro and is being posted with its permission. The views expressed in this material are solely those of the author and/or Roberto Delgado Castro and Interactive Brokers is not endorsing or recommending any investment or trading discussed in the material. This material is not and should not be construed as an offer to buy or sell any security. It should not be construed as research or investment advice or a recommendation to buy, sell or hold any security or commodity. This material does not and is not intended to take into account the particular financial conditions, investment objectives or requirements of individual customers. Before acting on this material, you should consider whether it is suitable for your particular circumstances and, as necessary, seek professional advice.
Join The Conversation
If you have a general question, it may already be covered in our FAQs. If you have an account-specific question or concern, please reach out to Client Services.