


Authors: Chainika Thakar (Originally written by Ishan Shah)
In the dynamic world of finance, the quest for investment strategies that yield consistent and profitable outcomes is ever-present. One such strategy, “Quantitative Value Investing,” stands out as a data-driven approach to identifying undervalued assets and making informed investment decisions.
Whether you are a novice investor or a seasoned pro looking to explore quantitative value investing, this guide will equip you with the knowledge and tools needed to embark on a data-driven journey toward financial success.
All the concepts covered in this blog are taken from this Quantra course on Factor Investing: Concepts and Strategies. You can take a Free Preview of the course.
This blog covers:
- Understanding value investing
- Quantitative value investing
- Difference of quantitative value investing from value investing
- Importance of quantitative value investing
- Types of data used in quantitative value investing
- How to build a quantitative value investing strategy in Python?
- Risk management and diversification with quantitative value investing
- Real life examples and case studies
- Limitations of quantitative value investing
- Tips to overcome the limitations
- Future trends in quantitative value investing
Understanding value investing
Value investing is a fundamental investment approach that focuses on identifying undervalued assets and purchasing them at a price below their intrinsic value (true worth). This strategy was popularised by renowned investors like Benjamin Graham and Warren Buffett and has been a cornerstone of successful long-term investing.
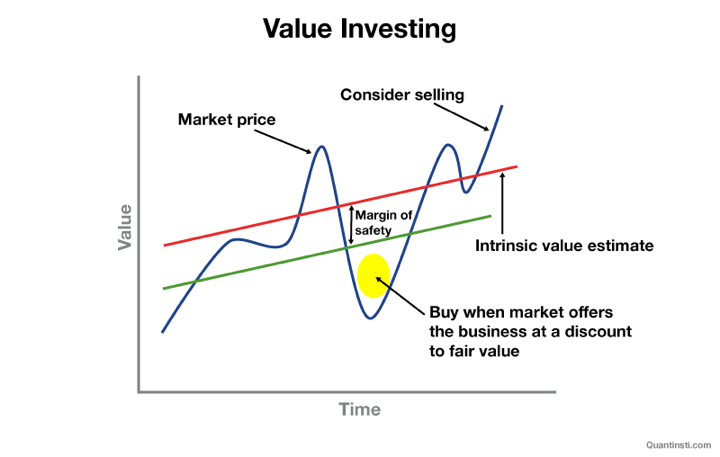
- Intrinsic value – The price level that reflects the actual worth or value of the company
- Margin of safety – The difference between purchase value and the true value
Quantitative value investing
Quantitative value investing is a data-driven approach to identifying undervalued assets for investment. It involves the use of quantitative analysis and financial metrics to make investment decisions. This method relies on mathematical models, statistical analysis, and historical data to determine the intrinsic value of assets and assess their potential for future returns.
Quantitative value investors seek to systematically screen and select investments based on predefined criteria and ratios, aiming to reduce subjectivity and emotion in decision-making.
Ratios used in quantitative value investing
Quantitative value investing relies on various financial ratios to assess the value of potential investments. The ratios are the indicators of whether a stock is undervalued or overvalued.
Here, it is important to note that overvaluation of stocks implies that the stocks are considered expensive, and buying them at such high prices may lead to capital losses. Investors often aim to avoid overvalued assets to protect their investment capital.
Whereas, undervalued stocks refer to shares of a company that are currently trading at a price lower than their intrinsic or fair value. In simpler terms, these stocks are considered cheaper than they should be based on the company’s financial health, performance, and future prospects.
Here are some of the key ratios commonly used in quantitative value investing used for finding out the real value of stocks:
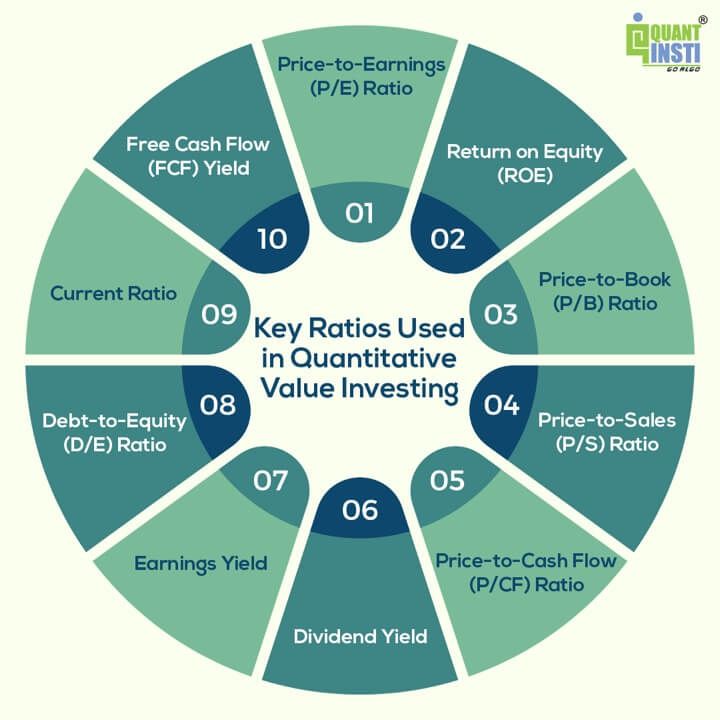
- Price-to-Earnings (P/E) Ratio: The P/E ratio compares a company’s stock price to its earnings per share (EPS). A lower P/E ratio is often seen as an indicator of undervaluation and higher P/E ratio implies overvaluation.
- Return on Equity (ROE): ROE measures a company’s profitability relative to its shareholders’ equity. A higher ROE is generally desirable.
- Price-to-Book (P/B) Ratio: The P/B ratio compares a company’s stock price to its book value per share (assets minus liabilities). A P/B ratio below 1 can suggest that a stock is undervalued and over 1 means an overvalued stock. It measures how the market values the company’s assets relative to its accounting value.
Accounting value represents the monetary worth of a business, calculated through assets, liabilities, and equity in financial statements.
- Price-to-Sales (P/S) Ratio: The P/S ratio compares a company’s stock price to its revenue per share. A lower P/S ratio can indicate undervaluation and a higher one means overvaluation.
- Price-to-Cash Flow (P/CF) Ratio: The P/CF ratio compares a company’s stock price to its cash flow per share. It helps assess a company’s ability to generate cash. A lower P/CF ratio may indicate that the stock is undervalued compared to its cash flow. A higher P/CF ratio could suggest overvaluation. It reflects how much cash the company generates relative to its stock price.
- Dividend Yield: Dividend yield measures the annual dividends paid by a company as a percentage of its stock price. A higher dividend yield may be attractive to income-focused investors. However, a very high yield could indicate financial distress.
This is so because the company may be using high dividends to attract investors because its stock price is falling. So, sometime in the near future the company may not be able to keep up with its promise of a high dividend yield. However, lower yield implies lower income from dividends relative to the stock price.
- Earnings Yield: The earnings yield is the inverse of the P/E ratio (Earnings Yield = 1/P/E). It’s a measure of how much a company earns in relation to its stock price. A higher earnings yield suggests better value. An earnings yield that’s significantly higher than the interest rates or the yield on alternative investments may indicate that the stock is undervalued. A lower earnings yield may suggest overvaluation.
- Debt-to-Equity (D/E) Ratio: The D/E ratio compares a company’s total debt to its equity. A lower D/E ratio indicates lower financial risk.
- Current Ratio: The current ratio measures a company’s ability to cover its short-term liabilities with its short-term assets. A higher current ratio is often preferred.
- Free Cash Flow (FCF) Yield: The FCF yield compares a company’s free cash flow to its market capitalisation. A higher FCF yield can indicate value and financial health.
These ratios are used to screen and evaluate stocks based on predefined quantitative criteria. Quantitative value investors often set specific thresholds for these ratios to identify undervalued stocks, and they may use combinations of these ratios to create comprehensive quantitative models for investment decision-making.
Difference of Quantitative Value Investing from Value Investing
Let us now find out the difference between quantitative value investing and value investing.
| Aspect | Value Investing | Quantitative Value Investing |
| Methodology | Qualitative analysis: Assessing company management, competitive advantage, and industry position. | Quantitative analysis: Using financial ratios mainly like P/E and P/B to determine intrinsic value. |
| Data Usage | Uses financial data but relies on non-financial factors. For example, considering a company’s brand reputation. | Primarily relies on financial data and ratios, such as assessing a stock’s attractiveness based on a low P/E ratio. |
| Emotion and Bias | Subject to emotional and cognitive biases due to qualitative assessments. For example, buying a stock based on personal preference. | Aims to reduce emotional biases. For example, disregarding personal preferences in favour of predefined data-based strategies. |
| Automation | Typically requires manual decision-making. For example, an investor uses personal judgement to decide when to buy or sell a stock. | Can be automated with algorithms. For example, setting up a program to automatically buy stocks that meet specific quantitative criteria. |
| Time Horizon | Often takes a long-term approach, with investors willing to hold assets for years or decades. | Time horizon can vary; for example, a quantitative strategy may involve shorter holding periods based on specific criteria. The shorter holding period allows them to exploit short-term market opportunities and manage risks more effectively compared to traditional value investors who work without quantitative techniques. |
| Objectivity | Involves a degree of subjectivity due to qualitative assessments. For example, assessing company management quality subjectively. | Strives for objectivity by relying on measurable quantitative criteria. For example, if the P/E ratio is below a specific threshold, the stock is considered objectively undervalued. |
Importance of Quantitative Value Investing
The importance of quantitative value investing lies in its ability to provide a systematic, data-driven, and disciplined approach to making investment decisions. Here are some key reasons why quantitative value investing is considered important:
- Objectivity: Quantitative value investing relies on quantitative metrics and predefined criteria, reducing the influence of emotions and cognitive biases in decision-making. This helps investors make more objective choices.
- Consistency: Quantitative models and criteria provide a consistent framework for evaluating investments. This consistency helps investors avoid impulsive decisions and stick to their strategy over the long term.
- Risk Management: Quantitative value investing often includes risk management elements. By using data-driven criteria, investors can identify and mitigate risks associated with their investments.
- Diversification: Quantitative strategies can be used to create diversified portfolios by selecting stocks or assets based on predefined criteria. Diversification helps spread risk and reduce the impact of negative events on individual investments.
- Efficiency: Automation is an integral part of many quantitative strategies. Computer algorithms can quickly analyse large datasets and screen for potential investments, making the investment process more efficient and less time-consuming.
- Historical Data Analysis: Quantitative value investing relies on historical data and statistical analysis to identify patterns and trends. This historical perspective can offer valuable insights into how assets have performed in the past.
- Systematic Approach: A systematic approach allows investors to easily compare different investment options, helping them choose those that best fit their investment goals and criteria.
- Measurability: The quantitative nature of this approach makes it highly measurable. Investors can track the performance of their investments against specific criteria, making it easier to assess the effectiveness of their strategy.
- Scalability: Quantitative value investing can be scaled to manage larger portfolios, making it suitable for both individual investors and institutional investors managing significant assets.
Stay tuned for Part II for details on building a quantitative value investing strategy in Python.
Originally posted on QuantInsti Blog.
Disclosure: Interactive Brokers
Information posted on IBKR Campus that is provided by third-parties does NOT constitute a recommendation that you should contract for the services of that third party. Third-party participants who contribute to IBKR Campus are independent of Interactive Brokers and Interactive Brokers does not make any representations or warranties concerning the services offered, their past or future performance, or the accuracy of the information provided by the third party. Past performance is no guarantee of future results.
This material is from QuantInsti and is being posted with its permission. The views expressed in this material are solely those of the author and/or QuantInsti and Interactive Brokers is not endorsing or recommending any investment or trading discussed in the material. This material is not and should not be construed as an offer to buy or sell any security. It should not be construed as research or investment advice or a recommendation to buy, sell or hold any security or commodity. This material does not and is not intended to take into account the particular financial conditions, investment objectives or requirements of individual customers. Before acting on this material, you should consider whether it is suitable for your particular circumstances and, as necessary, seek professional advice.
Join The Conversation
If you have a general question, it may already be covered in our FAQs. If you have an account-specific question or concern, please reach out to Client Services.