


This post shows how to read prices of stock indices given symbols as a string.
Read historical prices of stock indices
Source: I collected the symbols of major stock indices at https://finance.yahoo.com/world-indices
R code
The following R code retrieves historical daily prices of selected stock indices given their symbols as of 2022-08-14.
#========================================================#
# Quantitative ALM, Financial Econometrics & Derivatives
# ML/DL using R, Python, Tensorflow by Sang-Heon Lee
#
# https://shleeai.blogspot.com
#--------------------------------------------------------#
# read historical prices of stock indices
#========================================================#
graphics.off(); rm(list = ls())
library(quantmod)
library(stringr) # trim
#-------------------------------------------------
# Symbols of stock indices, as of 2022-08-14
#-------------------------------------------------
vstr_symbol <- "
Symbol , Name
^GSPC , S&P 500
^DJI , Dow 30
^IXIC , Nasdaq
^NYA , NYSE COMPOSITE (DJ)
^XAX , NYSE AMEX COMPOSITE INDEX
^BUK100P , Cboe UK 100
^RUT , Russell 2000
^VIX , CBOE Volatility Index
^FTSE , FTSE 100
^GDAXI , DAX PERFORMANCE-INDEX
^FCHI , CAC 40
^STOXX50E , ESTX 50 PR.EUR
^N100 , Euronext 100 Index
^BFX , BEL 20
^N225 , Nikkei 225
^HSI , HANG SENG INDEX
000001.SS , SSE Composite Index
399001.SZ , Shenzhen Index
^STI , STI Index
^AXJO , S&P/ASX 200
^AORD , ALL ORDINARIES
^BSESN , S&P BSE SENSEX
^JKSE , Jakarta Composite Index
^KLSE , FTSE Bursa Malaysia KLCI
^NZ50 , S&P/NZX 50 INDEX GROSS
^KS11 , KOSPI Composite Index
^TWII , TSEC weighted index
^GSPTSE , S&P/TSX Composite index
^BVSP , IBOVESPA
^MXX , IPC MEXICO
^TA125.TA , TA-125
^JN0U.JO , Top 40 USD Net TRI Index
"
#-------------------------------------------
# split symbols and make vector
#-------------------------------------------
df <- read.table(text = str_trim(vstr_symbol),
sep = ",", header = TRUE)
df <- as.data.frame(df); df
df$Symbol <- str_trim(gsub("[\t\r\n,]", "", df$Symbol))
df$Name <- str_trim(gsub("[\t\r\n,]", "", df$Name))
df
nc <- nrow(df) # number of index
#-------------------------------------------
# read price information
#-------------------------------------------
sdate <- as.Date("2001-01-01")
edate <- as.Date("2022-08-12")
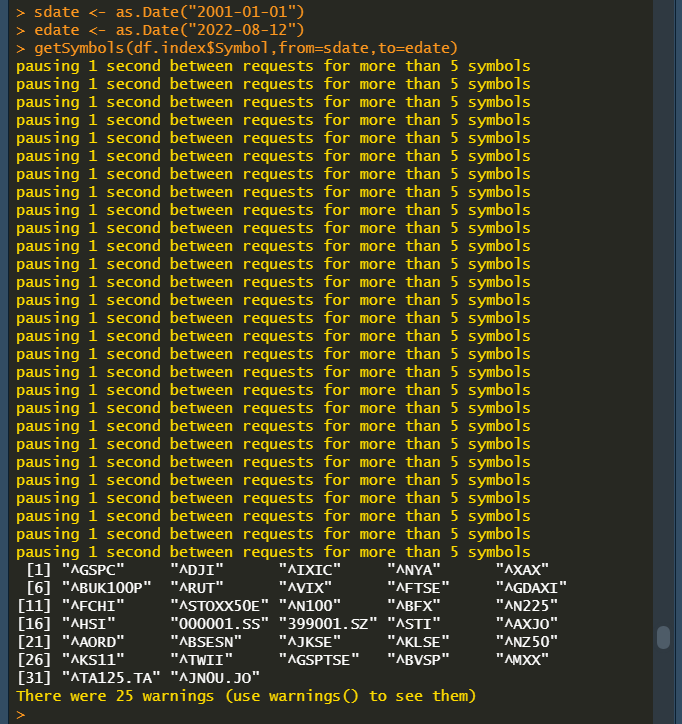
getSymbols(df$Symbol, from=sdate, to=edate)
#-------------------------------------------
# collect only adjusted prices
#-------------------------------------------
price <- NULL
for(i in 1:nc) {
eval(parse(text=paste0(
"price <- cbind(price,`",
gsub("\\^","",df$Symbol[i]),"`[,6])")))
}
# modify column Name as only symbol
colnames(price) <- gsub(".Adjusted", "",
colnames(price))
# convert to data.frame with the first column as Date
df.price <- cbind(time=time(price), as.data.frame(price))
rownames(df.price) <- NULL
# partial selection of complete cases
# by S&P 500, Nikkei 225, HANG SENG INDEX
df.price <- df.price[complete.cases(
df.price[,c("GSPC","N225","HSI")]),]
#-------------------------------------------
# print time series of daily prices
#-------------------------------------------
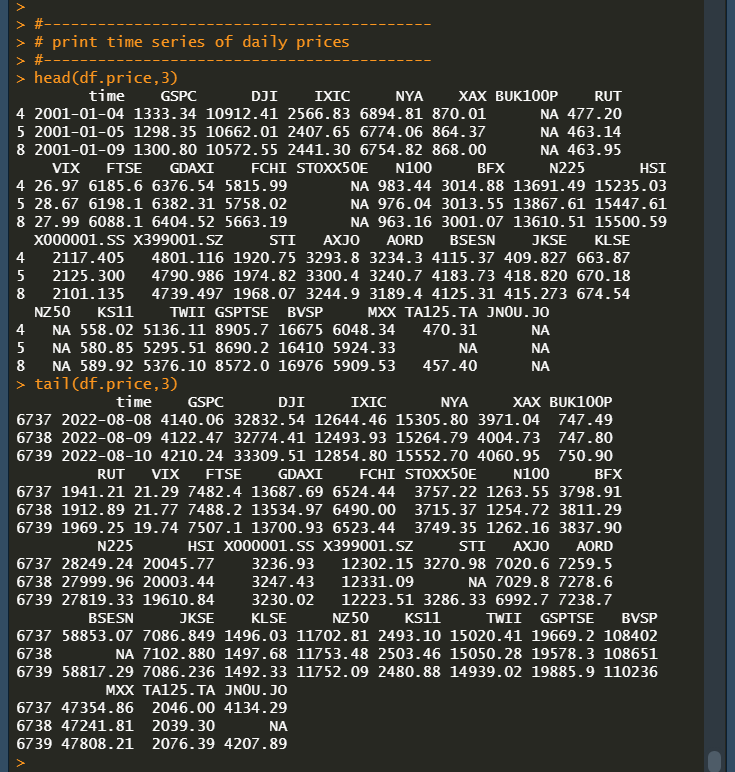
head(df.price,3)
tail(df.price,3)
Running the above R code displays the status of data reading process as follows.
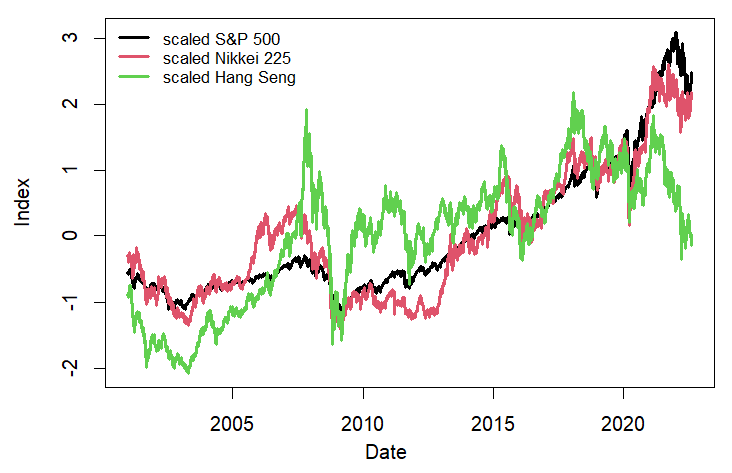
Finally, we can get the collection of individual stock indices.
Originally posted on SHLee AI Financial Model blog.
Disclosure: Interactive Brokers
Information posted on IBKR Campus that is provided by third-parties does NOT constitute a recommendation that you should contract for the services of that third party. Third-party participants who contribute to IBKR Campus are independent of Interactive Brokers and Interactive Brokers does not make any representations or warranties concerning the services offered, their past or future performance, or the accuracy of the information provided by the third party. Past performance is no guarantee of future results.
This material is from SHLee AI Financial Model and is being posted with its permission. The views expressed in this material are solely those of the author and/or SHLee AI Financial Model and Interactive Brokers is not endorsing or recommending any investment or trading discussed in the material. This material is not and should not be construed as an offer to buy or sell any security. It should not be construed as research or investment advice or a recommendation to buy, sell or hold any security or commodity. This material does not and is not intended to take into account the particular financial conditions, investment objectives or requirements of individual customers. Before acting on this material, you should consider whether it is suitable for your particular circumstances and, as necessary, seek professional advice.
Join The Conversation
If you have a general question, it may already be covered in our FAQs. If you have an account-specific question or concern, please reach out to Client Services.