


The article “Random Forest Algorithm In Trading Using Python” first appeared on QuantInsti Blog.
Excerpt
In the realm of algorithmic trading, the random forest algorithm offers a powerful approach for enhancing trading strategies.
In today’s data-driven landscape, the utilization of machine learning algorithms has expanded across diverse domains. Each algorithm has its own unique characteristics and functions, catering to different problem domains. Random forest algorithms is a prime example of an algorithm developed to address the limitations encountered with decision trees. As Machine learning algorithms continue to evolve and improve, their application scope widens, allowing for enhanced problem-solving capabilities.
This blog covers:
- What are decision trees and its limitation?
- What is a random forest?
- Working of random forest algorithm in machine learning
- Steps to use random forest algorithm for trading in Python
- Pros of using random forest algorithm
- Cons of using random forest algorithm
What are decision trees and its limitation?
Decision trees, characterized by their hierarchical structure, use nodes and branches to guide decision-making based on parameter responses.
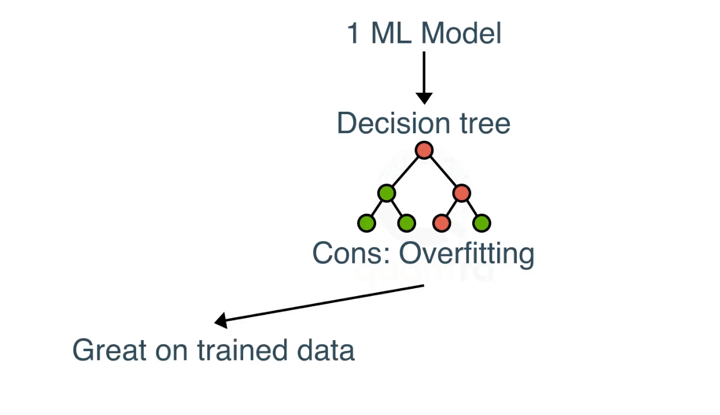
However, they are prone to overfitting as they become overly complex and specific.
In both machine learning, overfitting occurs when the model fits the data too well. Overfitting model learns the detail and noise in the training data to such an extent that it negatively impacts the performance of the model on new data/test data.
You can learn more about decision trees with this Free Preview of the course Decision trees in trading.
What is a random forest?
Random forest algorithm in machine learning is a supervised classification algorithm that addresses the issue of overfitting in decision trees through an ensemble approach. It consists of multiple decision trees constructed randomly by selecting features from the dataset.
The final prediction of the random forest is determined by aggregating the outcomes from the decision trees, with the most frequent prediction.
The outcome which is arrived at, for a maximum number of times through the numerous decision trees is considered as the final outcome by the random forest.
Working of random forest algorithm in machine learning
Random forests utilise ensemble learning techniques by combining multiple decision trees. The accuracy of ensemble models exceeds that of individual models by aggregating their results to produce a final outcome.
To select features for decision tree construction in the Random Forest, a method called bootstrap aggregating or bagging is employed. Random subsets of features are created by selecting features randomly with replacement. This random selection allows for variability and reduces correlation among the trees, effectively addressing the issue of overfitting.
Each tree is constructed based on the best split determined by the selected features. The output of each tree represents a “vote” towards a specific outcome. The Random Forest considers the output with the highest number of votes as the final result or, in the case of continuous variables, averages the outputs to determine the final outcome.
For example, in the diagram below, we can see that there are two trading signals:
- 1 – is the buy signal
- 0 – is the sell signal
We can observe that each decision tree has voted or predicted a specific trading signal. The final output or signal selected by the Random Forest will be 1, as it has majority votes or is the predicted output by two out of the three decision trees.
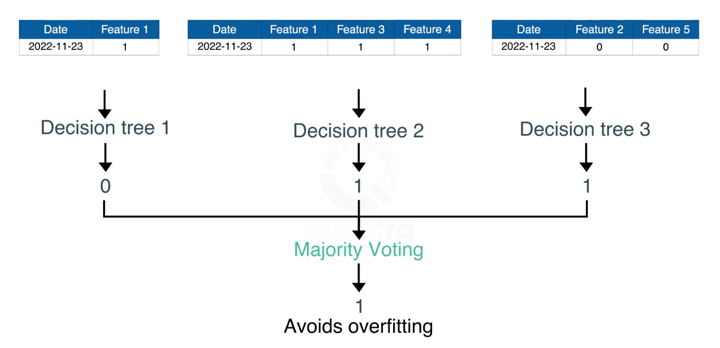
Also, this way, random forest algorithm helps avoid overfitting in the decision trees.
You can learn it in more detail in the free preview (Section 13, Unit 1) of our course titled Machine Learning for Options Trading.
Steps to use random forest algorithm for trading in Python
In general, the steps to use random forest in trading are:
Data Preparation
Collect and preprocess historical market data, perform cleaning, normalization, and feature engineering to enhance the dataset’s quality and relevance.
Data Split
Split the dataset into training and testing sets to evaluate the Random Forest model’s performance accurately
Building and Training the Model
Utilize Python’s scikit-learn library to implement the Random Forest algorithm, fine-tune hyperparameters, and train the model using the training dataset.
Feature Importance and Interpretability
Extract valuable insights by interpreting the Random Forest model’s feature importance rankings. Understand the influential factors driving trading strategies.
Backtesting and Strategy Evaluation
Apply the trained Random Forest model to historical market data for backtesting and evaluate the performance of the trading strategy using relevant metrics.
Now, let us check the steps in the python code, which are as follows:
Step 1 – Import libraries
In this code, we will be creating a Random Forest Classifier and train it to give the daily returns.
# Import libraries
import yfinance as yf
import numpy as np
from sklearn.ensemble import RandomForestClassifier
Import_libraries.py hosted with ❤ by GitHub
The libraries imported above will be used as follows:
- yfinance – this will be used to fetch the price data of the BAC stock from yahoo finance.
- numpy – to perform the data manipulation on BAC stock price to compute the input features and output. If you want to read more about numpy then it can be found here.
- sklearn – Sklearn has a lot of tools and implementation of machine learning models. RandomForestClassifier will be used to create Random Forest classifier model.
Step 2 – Fetching the data
The next step is to import the price data of stock from yfinance. We will use IBM for illustration.
# Fetch the IBM price data
data = yf.download('IBM', start="2019-01-01", end="2023-06-30")

# Display the data
data.tail()
Fetch_IBM_data.py hosted with ❤ by GitHub
Output:
[*********************100%***********************] 1 of 1 completed
| Date | Open | High | Low | Close | Adj Close | Volume |
| 2023-06-23 | 130.399994 | 130.619995 | 129.179993 | 129.429993 | 129.429993 | 11324700 |
| 2023-06-26 | 129.389999 | 131.410004 | 129.309998 | 131.339996 | 131.339996 | 4845600 |
| 2023-06-27 | 131.300003 | 132.949997 | 130.830002 | 132.339996 | 132.339996 | 3219900 |
| 2023-06-28 | 132.059998 | 132.169998 | 130.910004 | 131.759995 | 131.759995 | 2753800 |
| 2023-06-29 | 131.750000 | 134.350006 | 131.690002 | 134.059998 | 134.059998 | 3639800 |
Step 3 – Creating input and output dataset
In this step, we will create the input and output variable.
- Input variable: We have used ‘(Open – Close)/Open’, ‘(High – Low)/Low’, standard deviation of last 5 days returns (std_5), and average of last 5 days returns (ret_5)
- Output variable: If tomorrow’s close price is greater than today’s close price then the output variable is set to 1 and otherwise set to -1. 1 indicates to buy the stock and -1 indicates to sell the stock.
The choice of these features as input and output is completely random.
# Features construction
data['Open-Close'] = (data.Open - data.Close)/data.Open
data['High-Low'] = (data.High - data.Low)/data.Low
data['percent_change'] = data['Adj Close'].pct_change()
data['std_5'] = data['percent_change'].rolling(5).std()
data['ret_5'] = data['percent_change'].rolling(5).mean()
data.dropna(inplace=True)

# X is the input variable
X = data[['Open-Close', 'High-Low', 'std_5', 'ret_5']]

# Y is the target or output variable
y = np.where(data['Adj Close'].shift(-1) > data['Adj Close'], 1, -1)
Creating_input_output_data.py hosted with ❤ by GitHub
Step 4 – Train Test Split
We now split the dataset into 75% Training dataset and 25% for Testing dataset.
# Total dataset length
dataset_length = data.shape[0]

# Training dataset length
split = int(dataset_length * 0.75)
split
Train_test_split.py hosted with ❤ by GitHub
Output:
844
# Splitiing the X and y into train and test datasets
X_train, X_test = X[:split], X[split:]
y_train, y_test = y[:split], y[split:]

# Print the size of the train and test dataset
print(X_train.shape, X_test.shape)
print(y_train.shape, y_test.shape)
Split_X&Y.py hosted with ❤ by GitHub
Output:
(844, 4) (282, 4) (844,) (282,)
Visit QuantInsti to learn how to train the Machine Learning model and to read the full article: https://blog.quantinsti.com/random-forest-algorithm-in-python/.
Disclosure: Interactive Brokers
Information posted on IBKR Campus that is provided by third-parties does NOT constitute a recommendation that you should contract for the services of that third party. Third-party participants who contribute to IBKR Campus are independent of Interactive Brokers and Interactive Brokers does not make any representations or warranties concerning the services offered, their past or future performance, or the accuracy of the information provided by the third party. Past performance is no guarantee of future results.
This material is from QuantInsti and is being posted with its permission. The views expressed in this material are solely those of the author and/or QuantInsti and Interactive Brokers is not endorsing or recommending any investment or trading discussed in the material. This material is not and should not be construed as an offer to buy or sell any security. It should not be construed as research or investment advice or a recommendation to buy, sell or hold any security or commodity. This material does not and is not intended to take into account the particular financial conditions, investment objectives or requirements of individual customers. Before acting on this material, you should consider whether it is suitable for your particular circumstances and, as necessary, seek professional advice.
Join The Conversation
If you have a general question, it may already be covered in our FAQs. If you have an account-specific question or concern, please reach out to Client Services.