


Excerpt
In this blog, we’ll discuss what are Random Forests, how do they work, how they help in overcoming the limitations of decision trees.
With the boom of Machine Learning and its techniques in the current environment, more and more of its algorithms find applications in various domains. The functions and working of machine learning algorithms differ from each other wherein one algorithm may be better for a certain problem than another one. Machine Learning algorithms are constantly updated and upgraded to widen its range of applications and to minimize its shortcomings.
Random Forest algorithm is one such algorithm designed to overcome the limitations of Decision Trees.
In this blog, we will be covering:
- What are Decision Trees?
- What is a Random Forest?
- Working of Random Forest
- Python Code for Random Forest
- Advantages and Disadvantages of Random Forest
Before jumping directly to Random Forests, let’s first get a brief idea about decision trees and how they work.
What are Decision Trees?
Decision trees, just as the name suggests, have a hierarchical or tree-like structure with branches which act as nodes. We can arrive at a certain decision by traversing through these nodes which are based on the responses garnered from to the parameters related to the nodes.
However, decision trees suffer from a problem of overfitting. Overfitting is basically increasing the specificity within the tree to reach to a certain conclusion by adding more and more nodes in the tree thus increasing the depth of the tree and making it more complex.
Further, in this blog, we will understand how Random Forest helps to overcome this drawback of decision trees.
Learn how to make a decision tree to predict the markets and find trading opportunities using AI techniques with our Quantra course.
What is a Random Forest?
Random forest is a supervised classification machine learning algorithm which uses ensemble method. Simply put, a random forest is made up of numerous decision trees and helps to tackle the problem of overfitting in decision trees. These decision trees are randomly constructed by selecting random features from the given dataset.
Random forest arrives at a decision or prediction based on the maximum number of votes received from the decision trees. The outcome which is arrived at, for a maximum number of times through the numerous decision trees is considered as the final outcome by the random forest.
Working of Random Forest
Random forests are based on ensemble learning techniques. Ensemble, simply means a group or a collection, which in this case, is a collection of decision trees, together called as random forest. The accuracy of ensemble models is better than the accuracy of individual models due to the fact that it compiles the results from the individual models and provides a final outcome.
How to select features from the dataset to construct decision trees for the Random Forest?
Features are selected randomly using a method known as bootstrap aggregating or bagging. From the set of features available in the dataset, a number of training subsets are created by choosing random features with replacement. What this means is that one feature may be repeated in different training subsets at the same time.
For example, if a dataset contains 20 features and subsets of 5 features are to be selected to construct different decision trees then these 5 features will be selected randomly and any feature can be a part of more than one subset. This ensures randomness, making the correlation between the trees less, thus overcoming the problem of overfitting.
Once the features are selected, the trees are constructed based on the best split. Each tree gives an output which is considered as a ‘vote’ from that tree to the given output. The output
which receives the maximum ‘votes’ is chosen by the random forest as the final output/result or in case of continuous variables, the average of all the outputs is considered as the final output.
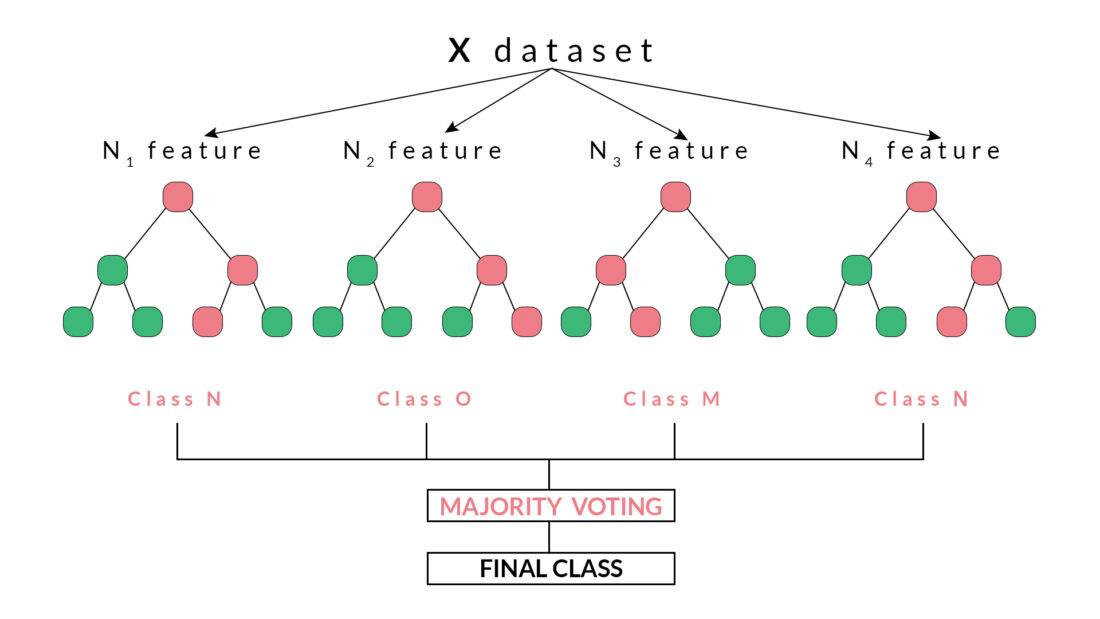
For example, in the above diagram, we can observe that each decision tree has voted or predicted a specific class. The final output or class selected by the Random Forest will be the Class N, as it has majority votes or is the predicted output by two out of the four decision trees.
Python Code For Random Forest
In this code, we will be creating a Random Forest Classifier and train it to give the daily returns.
Importing the libraries
In [ ]:
import quantrautil as q
import numpy as np
from sklearn.ensemble import RandomForestClassifier
The libraries imported above will be used as follows:
- quantrautil – this will be used to fetch the price data of the BAC stock from yahoo finance.
- numpy – to perform the data manipulation on BAC stock price to compute the input features and output. If you want to read more about numpy then it can be found here.
- sklearn – Sklearn has a lot of tools and implementation of machine learning models. RandomForestClassifier will be used to create Random Forest classifier model.
Fetching the data
The next step is to import the price data of BAC stock from quantrautil. The get_data function from quantrautil is used to get the BAC data for 19 years from 1 Jan 2000 to 31 Jan 2019 as shown below. The data is stored in the dataframe data.
In [2]:
data = q.get_data('BAC','2000-1-1','2019-2-1')
print(data.tail())
[*********************100%***********************]  1 of 1 downloaded
                 Open       High        Low      Close  Adj Close     Volume  \
Date
2019-01-25  29.280001  29.719999  29.139999  29.580000  29.580000   72182100
2019-01-28  29.320000  29.670000  29.290001  29.629999  29.629999   59963800
2019-01-29  29.540001  29.700001  29.340000  29.389999  29.389999   51451900
2019-01-30  29.420000  29.469999  28.950001  29.070000  29.070000   66475800
2019-01-31  28.750000  28.840000  27.980000  28.469999  28.469999  100201200

           Source
Date
2019-01-25  Yahoo
2019-01-28  Yahoo
2019-01-29  Yahoo
2019-01-30  Yahoo
2019-01-31  Yahoo
Creating input and output dataset
In this step, I will create the input and output variable.
- Input variable: I have used ‘(Open – Close)/Open’, ‘(High – Low)/Low’, standard deviation of last 5 days returns (std_5), and average of last 5 days returns (ret_5)
- Output variable: If tomorrow’s close price is greater than today’s close price then the output variable is set to 1 and otherwise set to -1. 1 indicates to buy the stock and -1 indicates to sell the stock.
The choice of these features as input and output is completely random. If you are interested to learn more about feature selection then you can read here.
In [3]:
# Features construction
data['Open-Close'] = (data.Open - data.Close)/data.Open
data['High-Low'] = (data.High - data.Low)/data.Low
data['percent_change'] = data['Adj Close'].pct_change()
data['std_5'] = data['percent_change'].rolling(5).std()
data['ret_5'] = data['percent_change'].rolling(5).mean()
data.dropna(inplace=True)

# X is the input variable
X = data[['Open-Close', 'High-Low', 'std_5', 'ret_5']]

# Y is the target or output variable
y = np.where(data['Adj Close'].shift(-1) > data['Adj Close'], 1, -1)
In [4]:
Train Test Split
We now split the dataset into 75% Training dataset and 25% for Testing dataset.
# Total dataset length
dataset_length = data.shape[0]

# Training dataset length
split = int(dataset_length * 0.75)
split
Out[4]:
3597
In [5]:
# Splitiing the X and y into train and test datasets
X_train, X_test = X[:split], X[split:]
y_train, y_test = y[:split], y[split:]

# Print the size of the train and test dataset
print(X_train.shape, X_test.shape)
print(y_train.shape, y_test.shape)
(3597, 4) (1199, 4)
(3597,) (1199,)
Originally posted on QuantInsti Blog. Visit their website to read more on this topic.
Disclosure: Interactive Brokers
Information posted on IBKR Campus that is provided by third-parties does NOT constitute a recommendation that you should contract for the services of that third party. Third-party participants who contribute to IBKR Campus are independent of Interactive Brokers and Interactive Brokers does not make any representations or warranties concerning the services offered, their past or future performance, or the accuracy of the information provided by the third party. Past performance is no guarantee of future results.
This material is from QuantInsti and is being posted with its permission. The views expressed in this material are solely those of the author and/or QuantInsti and Interactive Brokers is not endorsing or recommending any investment or trading discussed in the material. This material is not and should not be construed as an offer to buy or sell any security. It should not be construed as research or investment advice or a recommendation to buy, sell or hold any security or commodity. This material does not and is not intended to take into account the particular financial conditions, investment objectives or requirements of individual customers. Before acting on this material, you should consider whether it is suitable for your particular circumstances and, as necessary, seek professional advice.
Join The Conversation
If you have a general question, it may already be covered in our FAQs. If you have an account-specific question or concern, please reach out to Client Services.