


Seasonality is a fascinating phenomenon in the world of stock trading. It refers to the predictable patterns and trends that occur in the financial markets at specific times during the year. In this comprehensive blog, we’ll explore the core concepts and practical aspects of seasonality trading.
In this blog, we will cut through the complexities of predictable market patterns and arm you with actionable strategies for navigating the financial landscape. If you’ve ever pondered the cyclical nature of stock prices and the strategic advantages they offer, you’re in the right place. In this blog, we’ll demystify seasonality, highlighting its crucial role in stock trading and providing you with insights and practical strategies to make informed decisions throughout the year.
Seasonality in time series, stock seasonality, and seasonal trading aren’t just industry jargon; they’re trading tools used to gain an edge in the dynamic world of finance. We’ll break down seasonality from understanding recurring patterns in data to applying powerful trading strategies. Whether you’re a seasoned investor or just starting out, our goal is to equip you with the knowledge and tools to leverage seasonal opportunities and make well-informed decisions.
From calendar-based strategies to holiday-driven strategies, we’ll explore real-life examples illustrating the impact of seasonality on stock markets. You’ll grasp the importance of seasonality in trading, master risk management through diversified portfolios, and understand how market sentiment shapes strategic trading decisions.
As we guide you through implementing seasonality trading strategies in Python, expect practical insights into backtesting with the help of which, you can optimise your approach. Join us on this direct journey, and unlock the power of seasonality trading for a more informed and strategic approach to investing.
Some of the concepts covered in this blog are taken from this Quantra course on Event driven trading strategies. If you’d like to understand the course’s structure and the topics it covers, you can take advantage of the course’s Preview feature for free.
Let us learn more about seasonality trading and its strategy with this blog that covers:
- What is seasonality?
- Example of seasonality in trading
- Importance of seasonality in trading
- Seasonality trading strategies
- How to implement a seasonality trading strategy in python
- Potential drawbacks of seasonality trading
What is seasonality?
Seasonality refers to the recurring and predictable patterns or fluctuations in data or events that tend to repeat at specific times within a given period, typically on a yearly, quarterly, monthly, or weekly basis.
In financial markets, seasonality can manifest as periodic price movements or trading trends that coincide with certain times of the year, such as holidays, seasons, or fiscal quarters. Understanding seasonality is crucial for making informed decisions in the trading domain.
To summarise, seasonality trading is a method that combines historical data analysis with well-defined trading rules. This approach has gained popularity as it allows traders and investors to potentially exploit recurring opportunities and make informed decisions.
Example of seasonality in trading
Example – Santa Claus Rally:
One well-known example of seasonality trading is the “Santa Claus Rally.” This refers to the historical tendency for stock markets to experience a positive upswing during the last five trading days of December and the first two trading days of January. This period encompasses the Christmas and New Year holidays.
The Santa Claus Rally is based on the idea that, during the holiday season, investors often display a more optimistic and festive sentiment. They might be influenced by year-end bonuses, tax considerations, and the general goodwill associated with the holidays. As a result, stock prices tend to rise during this time.
Traders and investors have, over the years, noticed this seasonality pattern and sometimes adjust their trading strategies to take advantage of it. They may choose to enter or hold positions during this period, anticipating the potential for price increases.
Importance of seasonality in trading
Seasonality trading can be a powerful tool, especially for those new to the world of financial markets.
Here’s why it matters:
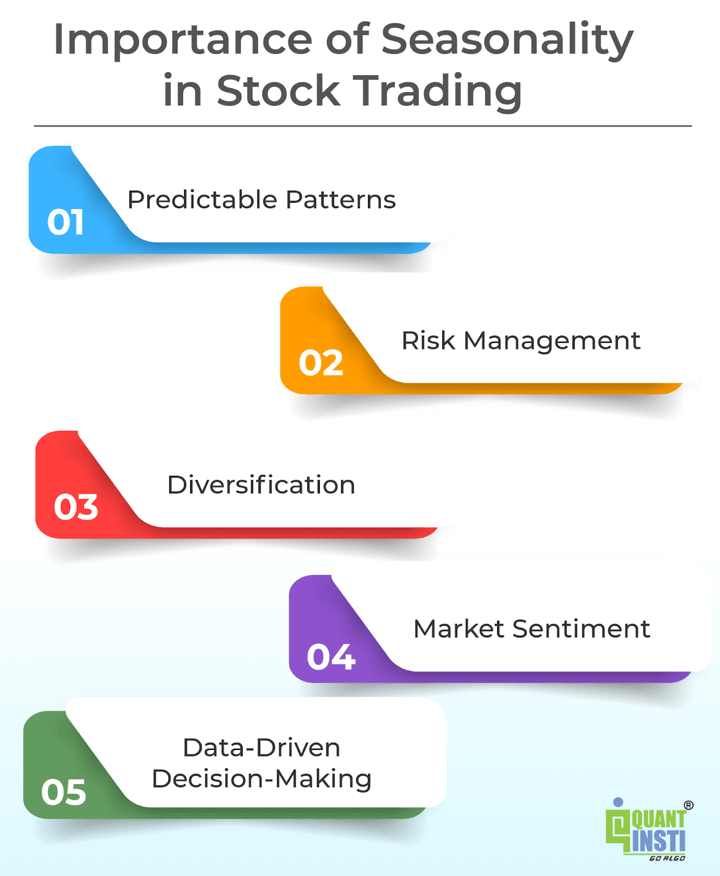
- Predictable Patterns: Seasonality allows us to identify recurring trends in stock prices, much like how we anticipate changing seasons throughout the year. Recognising these patterns can help us make educated guesses about price movements.
For example, if you notice that every year, around the holiday season, the stock prices of companies in the retail sector tend to rise. This is a predictable seasonal pattern. - Risk Management: Just as we prepare for different weather conditions by carrying an umbrella or sunscreen, seasonality can help us manage risk by adjusting our trading strategies during favourable or unfavourable market periods.
For example, during corporate earnings seasons, when companies report financial results, you might reevaluate your holdings based on the market’s reaction to those reports, making informed decisions to manage risk and capitalise on opportunities. - Diversification: Diversifying a portfolio is akin to planting a variety of crops to reduce the risk of a poor harvest. Seasonal patterns vary across sectors, so diversifying investments in line with these patterns can reduce risk and enhance overall performance.
For example, while utility companies may perform well in the summer due to the extra need for electricity and water, pharma companies tend to do better in the winter when the flu is on the rise. By diversifying your portfolio to include both sectors, you reduce risk. - Market Sentiment: Seasonal trends can reflect consumer behaviour, holiday-related spending, and economic cycles, providing insights into market sentiment and helping us adjust our trading approach.
For example, consider the retail sector during the holiday season. Positive sentiment and increased consumer spending can drive stock prices of retail companies higher. Conversely, during economic downturns, consumer caution may impact spending, affecting retail stocks negatively. - Data-Driven Decision-Making: Seasonality promotes an analytical and disciplined approach to trading, encouraging traders to rely on facts and historical patterns rather than emotions.
For example, instead of impulsively selling a stock during a market dip due to fear, you rely on historical data and your trading strategy to make informed decisions, which can prevent unnecessary losses.
While seasonality can be a valuable asset for traders, it should always be used in conjunction with other forms of analysis. Market conditions change, and past performance is not a guarantee of future results. Incorporating seasonality into your trading approach can enhance your understanding of the market and contribute to better-informed investment decisions.
Seasonality trading strategies
Seasonality trading strategies are based on identifying and leveraging recurring patterns in asset prices or market behaviours during specific times of the year.
Here’s a list of some common seasonality trading strategies:
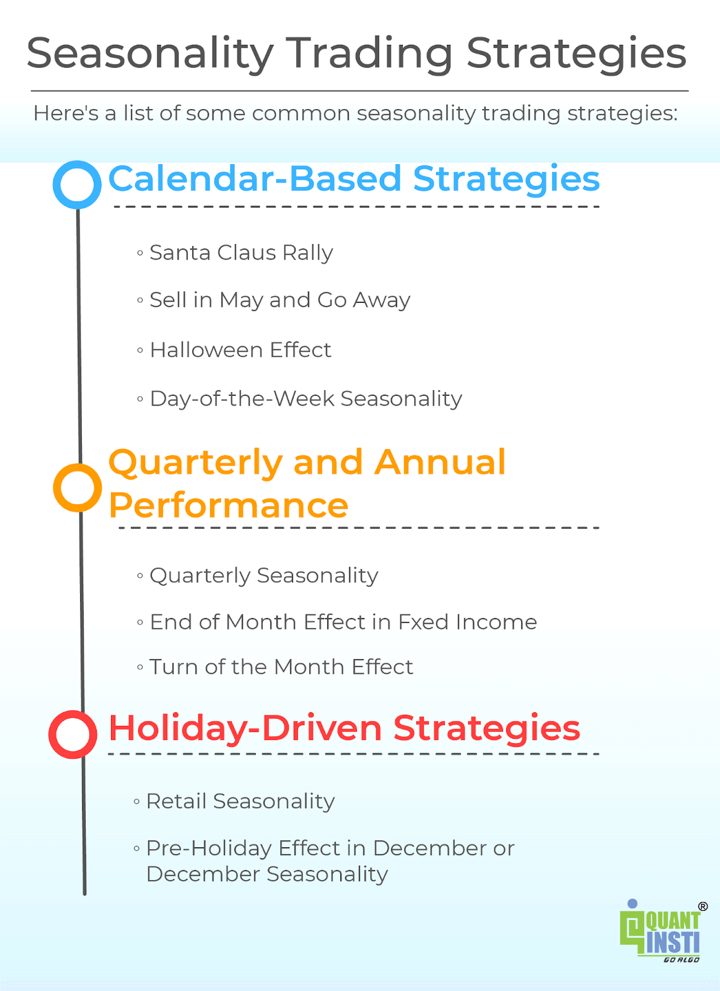
Calendar-based strategies
- Santa Claus Rally: This strategy involves taking long positions in the stock market during the last five trading days of December and the first two trading days of January. Historically, stock prices tend to rise during this period. Investors tend to take long positions in the stock market during the last five trading days of December and the first two trading days of January.
- Sell in May and Go Away: This strategy suggests selling stocks in May and staying out of the market until November, as the summer months often experience lower returns. Investors then re-enter the market for the winter season. Hence, investors may opt to exit to avoid potential downturns, and then re-enter in November when markets historically show stronger performance.
- Halloween Effect: Similar to the “Sell in May and Go Away” strategy or even recognised as a part of the same, Halloween Effect involves buying stocks around Halloween and holding them until the end of April. Historically, this period has shown stronger stock market performance.
- Day-of-the-Week Seasonality: This strategy focuses on assets that tend to perform differently on specific days of the trading week. For example, traders buy stocks on Mondays and sell on Fridays based on historical patterns.
Traders buying stocks on Mondays and selling on Fridays, known as the Monday and Friday Effects are based on historical patterns. Reasons include reacting to weekend news on Mondays, a perceived positive bias, and selling on Fridays to manage weekend risk.
Quarterly and annual performance
- Quarterly Seasonality: Traders can analyse the historical performance of assets within specific quarters to time entry and exit points. For instance, the “January Effect” involves buying small-cap stocks in January, historically associated with a positive price movement.
- End of month effect in fixed income: This is a pattern in the timing of excess returns on coupon treasury securities. It has been observed in the historical analysis that the average returns on coupon treasury securities are positive and highly significant in the last few days of the month and are not significantly different from zero at other times. For instance, if an investor takes a position they can hold iShares 20+ Year Treasury Bond ETF (ticker: TLT) for the last two days before the end of a month.
- Turn of the month effect: The turn of the month is a well-known effect on stock indices, with the simple idea that equity prices usually increase during the last four days and the first three days of each month. Research conducted over the years identified such a pattern for multiple periods, both in the Dow Jones Industrial Average and the S&P 500 index.
Holiday-Driven Strategies
- Retail Seasonality: Retail stocks typically witness robust performance during the holiday shopping season, driven by increased consumer spending on gifts and festive purchases. As consumers engage in holiday shopping, retail companies experience higher sales and revenue. Traders strategically adopt a long position on retail stocks in anticipation of this surge in consumer activity, aiming to capitalise on the positive market sentiment and potential stock price appreciation associated with the holiday season.
- Pre-holiday effect in December or December seasonality: This effect is a well known anomaly. There is a drop in the returns between the VIX futures expiration which happens right before Christmas. There is usually heightened sentiment in the market and lower volatility as Christmas arrives. That is why we take a short position from December’s VIX futures expiration till before Christmas.
Stay tuned for the next installment to learn about a seasonality trading strategy in Python.
Originally posted on QuantInsti blog.
Disclosure: Interactive Brokers
Information posted on IBKR Campus that is provided by third-parties does NOT constitute a recommendation that you should contract for the services of that third party. Third-party participants who contribute to IBKR Campus are independent of Interactive Brokers and Interactive Brokers does not make any representations or warranties concerning the services offered, their past or future performance, or the accuracy of the information provided by the third party. Past performance is no guarantee of future results.
This material is from QuantInsti and is being posted with its permission. The views expressed in this material are solely those of the author and/or QuantInsti and Interactive Brokers is not endorsing or recommending any investment or trading discussed in the material. This material is not and should not be construed as an offer to buy or sell any security. It should not be construed as research or investment advice or a recommendation to buy, sell or hold any security or commodity. This material does not and is not intended to take into account the particular financial conditions, investment objectives or requirements of individual customers. Before acting on this material, you should consider whether it is suitable for your particular circumstances and, as necessary, seek professional advice.
Disclosure: Futures Trading
Futures are not suitable for all investors. The amount you may lose may be greater than your initial investment. Before trading futures, please read the CFTC Risk Disclosure. A copy and additional information are available at ibkr.com.
Join The Conversation
If you have a general question, it may already be covered in our FAQs. If you have an account-specific question or concern, please reach out to Client Services.