


Part I discusses the basics of Standard Deviation.
Examples of standard deviation from real life
The term standard deviation sounds like something you hear in a statistics class, but don’t dismiss it as an overly technical term just yet. It can be used in different aspects of our lives.
A teacher can use the standard deviation of marks of her students in an exam as a metric to assess the overall level of understanding of the subject. If the mean and standard deviation are both high, it indicates that, on an average, students have a good understanding of the subject.
However, there would be many students who have scores that are much above and much below the average scores. In case the mean is high and standard deviation is low, it indicates that the average scores are similar to the previous case.
The low standard deviation tells her that most students have scores that are close (i.e. slightly above and slightly below) to the mean. In weather forecasting, it can be used to compare the weather patterns in two or more regions.
If we compare the standard deviation of temperatures in Jaisalmer (which has extreme weather) with Mumbai (which has moderate weather), we would find that the former has more variability in temperature around the mean.
Why use standard deviation?
Unit of standard deviation
The unit of standard deviation would be the same as the unit of our data. This makes it easier to interpret compared to the variance. In the next section, we do a detailed comparison between these two measures of dispersion.
Standard deviation vs Variance
The variance σ2 of a random variable X is given by the formula below:

As we can see, by its very construction, the variance is in the square of the original unit. This means that if we are dealing with distances in kilometres, the unit of variance would be in square kilometres. Now, square kilometres may be easy to visualize as a unit, but what about year2 or IQ2, if we are working with ages or IQs of a group? They are harder to interpret.
Hence, it makes sense to use a measure that can be comparable to the data on the same scale/units, like the standard deviation.
Standard deviation is calculated as the square root of variance. It has the same unit as our data and this makes it easy to use and interpret.
For example, consider a scenario where we are looking at a dataset of the heights of residents of a neighbourhood. Assume that the heights are normally distributed with a mean of 165 cm and standard deviation of 5 cm.
We know that for a normal distribution,
- 68% of the data points fall within one standard deviation,
- 95% within two standard deviations, and
- 99.7% fall within three standard deviations from the mean.
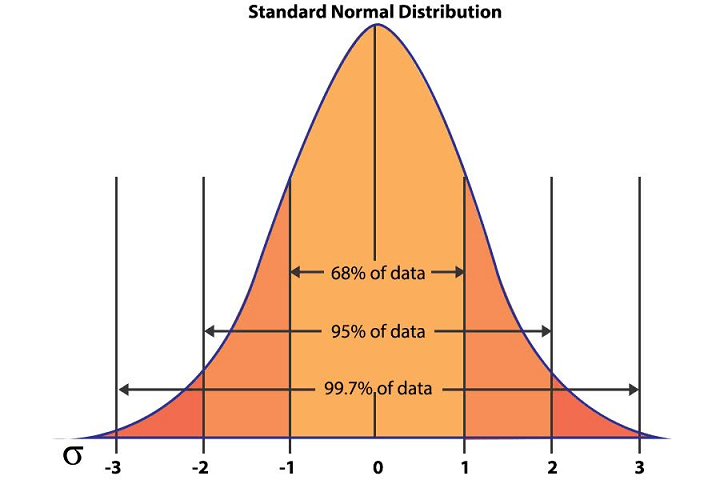
Standard Normal Distribution (Image Source: Standard Normal Distribution)
Thus, we can conclude that the height of almost 68% of the residents would lie between one standard deviation from the mean, i.e., between 160 cm (mean – sd) and 170 cm (mean + sd). You can read more about normal distribution here.
Stay tuned for the next installment, in which the authors will use Bessel’s correction.
Visit QuantInsti for additional insight on this topic: https://blog.quantinsti.com/standard-deviation/
Disclosure: Interactive Brokers
Information posted on IBKR Campus that is provided by third-parties does NOT constitute a recommendation that you should contract for the services of that third party. Third-party participants who contribute to IBKR Campus are independent of Interactive Brokers and Interactive Brokers does not make any representations or warranties concerning the services offered, their past or future performance, or the accuracy of the information provided by the third party. Past performance is no guarantee of future results.
This material is from QuantInsti and is being posted with its permission. The views expressed in this material are solely those of the author and/or QuantInsti and Interactive Brokers is not endorsing or recommending any investment or trading discussed in the material. This material is not and should not be construed as an offer to buy or sell any security. It should not be construed as research or investment advice or a recommendation to buy, sell or hold any security or commodity. This material does not and is not intended to take into account the particular financial conditions, investment objectives or requirements of individual customers. Before acting on this material, you should consider whether it is suitable for your particular circumstances and, as necessary, seek professional advice.