


The article “Stock Market Data: Obtaining Data, Visualization & Analysis in Python” first appeared on QuantInsti blog.
Are you looking to get stock market data and analyse the historical data in Python? You have come to right place.
After reading this, you will be able to:
- Get historical data for stocks
- Plot the stock market data and analyse the performance
- Get the fundamental, futures and options data
Yahoo Finance
One of the first sources from which you can get historical daily price-volume stock market data is Yahoo finance. You can use pandas_datareader or yfinance module to get the data and then can download or store in a csv file by using pandas.to_csv method.
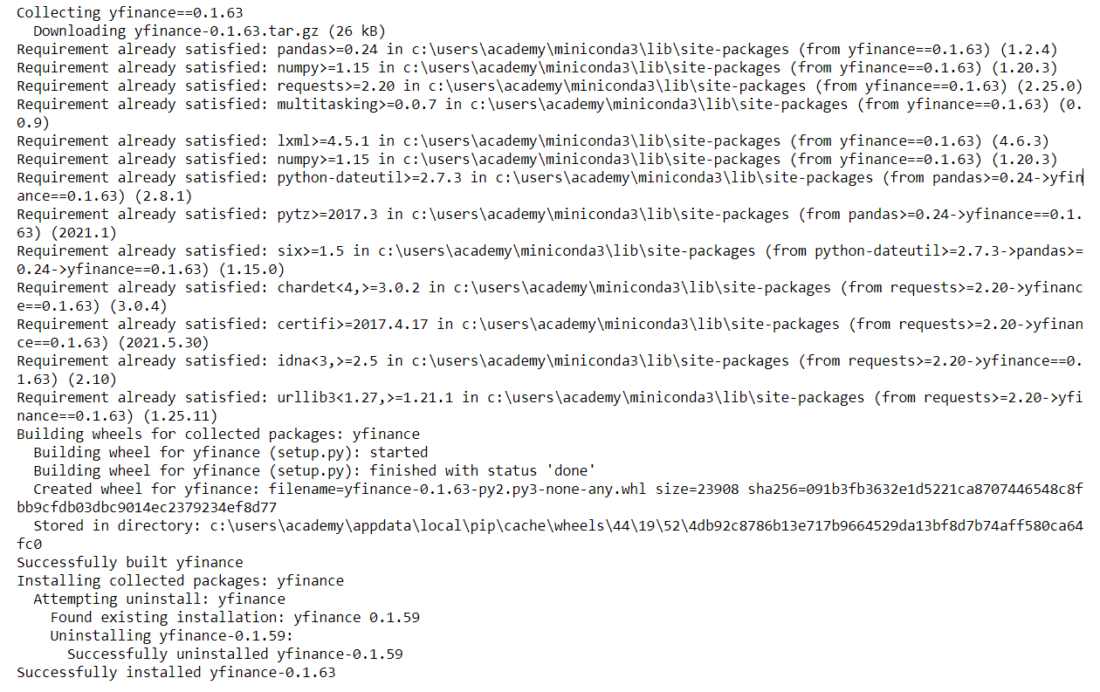
If yfinance is not installed on your computer, then run the below line of code from your Jupyter Notebook to install yfinance.
!pip install yfinance
install yfinance.py hosted with ❤ by GitHub
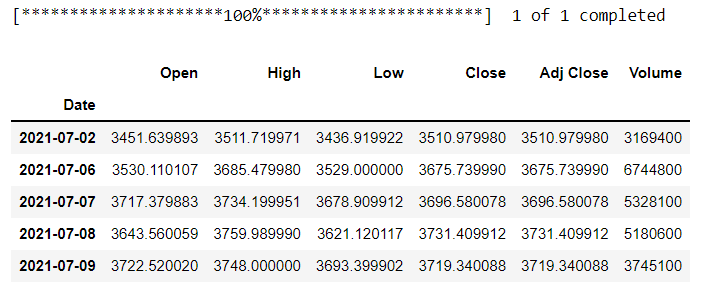
# Import yfinance package
import yfinance as yf

# Set the start and end date
start_date = '1990-01-01'
end_date = '2021-07-12'

# Set the ticker
ticker = 'AMZN'

# Get the data
data = yf.download(ticker, start_date, end_date)

# Print 5 rows
data.tail()
amazon_data.py hosted with ❤ by GitHub
To visualize the adjusted close price data, you can use the matplotlib library and plot method as shown below.
# Import matplotlib for plotting
import matplotlib.pyplot as plt
%matplotlib inline

# Plot adjusted close price data
data['Adj Close'].plot()
plt.show()
plot_amazn_data.py hosted with ❤ by GitHub
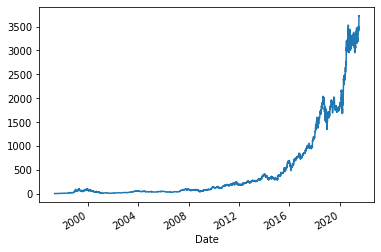
Data Source: Yahoo Finance
Let us improve the plot by resizing, giving appropriate labels and adding grid lines for better readability.
# Plot the adjusted close price
data['Adj Close'].plot(figsize=(10, 7))

# Define the label for the title of the figure
plt.title("Adjusted Close Price of %s" % ticker, fontsize=16)

# Define the labels for x-axis and y-axis
plt.ylabel('Price', fontsize=14)
plt.xlabel('Year', fontsize=14)

# Plot the grid lines
plt.grid(which="major", color='k', linestyle='-.', linewidth=0.5)

# Show the plot
plt.show()
plot_amzn_data_with_grids.py hosted with ❤ by GitHub
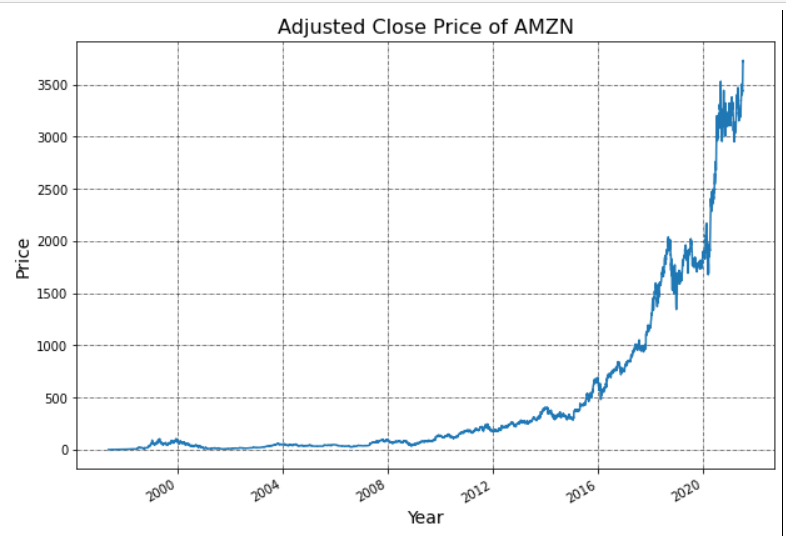
Data Source: Yahoo Finance
Advantages
- Adjusted close price stock market data is available
- Most recent stock market data is available
- Doesn’t require API key to fetch the stock market data
How to get Stock Market Data for different geographies?
To get stock market data for different geographies, search the ticker symbol on Yahoo finance and use that as the ticker.
Get stock market data for multiple tickers
To get the stock market data of multiple stock tickers, you can create a list of tickers and call the yfinance download method for each stock ticker.
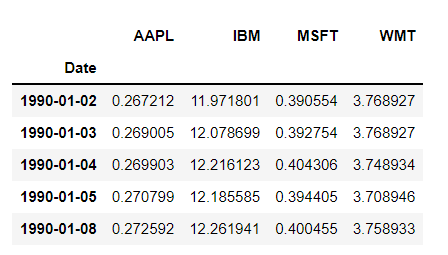
For simplicity, I have created a dataframe data to store the adjusted close price of the stocks.
# Import packages
import yfinance as yf
import pandas as pd

# Set the start and end date
start_date = '1990-01-01'
end_date = '2021-07-12'

# Define the ticker list
tickers_list = ['AAPL', 'IBM', 'MSFT', 'WMT']

# Create placeholder for data
data = pd.DataFrame(columns=tickers_list)

# Fetch the data
for ticker in tickers_list:
    data[ticker] = yf.download(ticker,
                               start_date,
                               end_date)['Adj Close']

# Print first 5 rows of the data
data.head()
multiple_tickers_data.py hosted with ❤ by GitHub
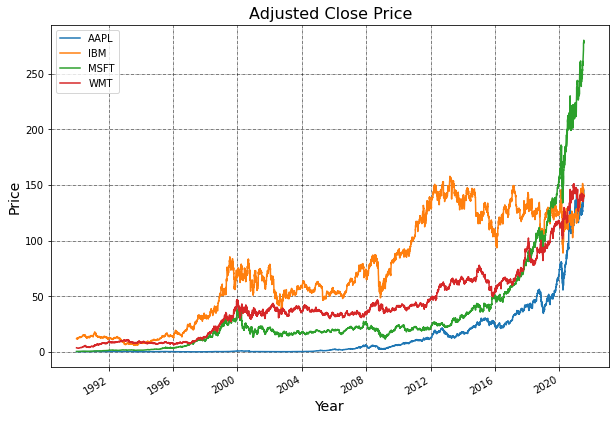
# Plot all the close prices
data.plot(figsize=(10, 7))

# Show the legend
plt.legend()

# Define the label for the title of the figure
plt.title("Adjusted Close Price", fontsize=16)

# Define the labels for x-axis and y-axis
plt.ylabel('Price', fontsize=14)
plt.xlabel('Year', fontsize=14)

# Plot the grid lines
plt.grid(which="major", color='k', linestyle='-.', linewidth=0.5)
plt.show()
plot_multiple_tickers_data.py hosted with ❤ by GitHub
Data Source: Yahoo Finance
Visit QuantInsti blog to learn how to retrieve data for S&P 500 stock tickers.
Join The Conversation
If you have a general question, it may already be covered in our FAQs. If you have an account-specific question or concern, please reach out to Client Services.
Leave a Reply
Disclosure: Interactive Brokers
Information posted on IBKR Campus that is provided by third-parties does NOT constitute a recommendation that you should contract for the services of that third party. Third-party participants who contribute to IBKR Campus are independent of Interactive Brokers and Interactive Brokers does not make any representations or warranties concerning the services offered, their past or future performance, or the accuracy of the information provided by the third party. Past performance is no guarantee of future results.
This material is from QuantInsti and is being posted with its permission. The views expressed in this material are solely those of the author and/or QuantInsti and Interactive Brokers is not endorsing or recommending any investment or trading discussed in the material. This material is not and should not be construed as an offer to buy or sell any security. It should not be construed as research or investment advice or a recommendation to buy, sell or hold any security or commodity. This material does not and is not intended to take into account the particular financial conditions, investment objectives or requirements of individual customers. Before acting on this material, you should consider whether it is suitable for your particular circumstances and, as necessary, seek professional advice.
Great post! I really appreciate these step-by-step tutorials. Thank you!
Nothing makes us happier than satisfied customers.
appreciated
We hope you continue to enjoy IBKR Quant!