


Learn the definition of TRIN with Part I in this series.
Example of TRIN
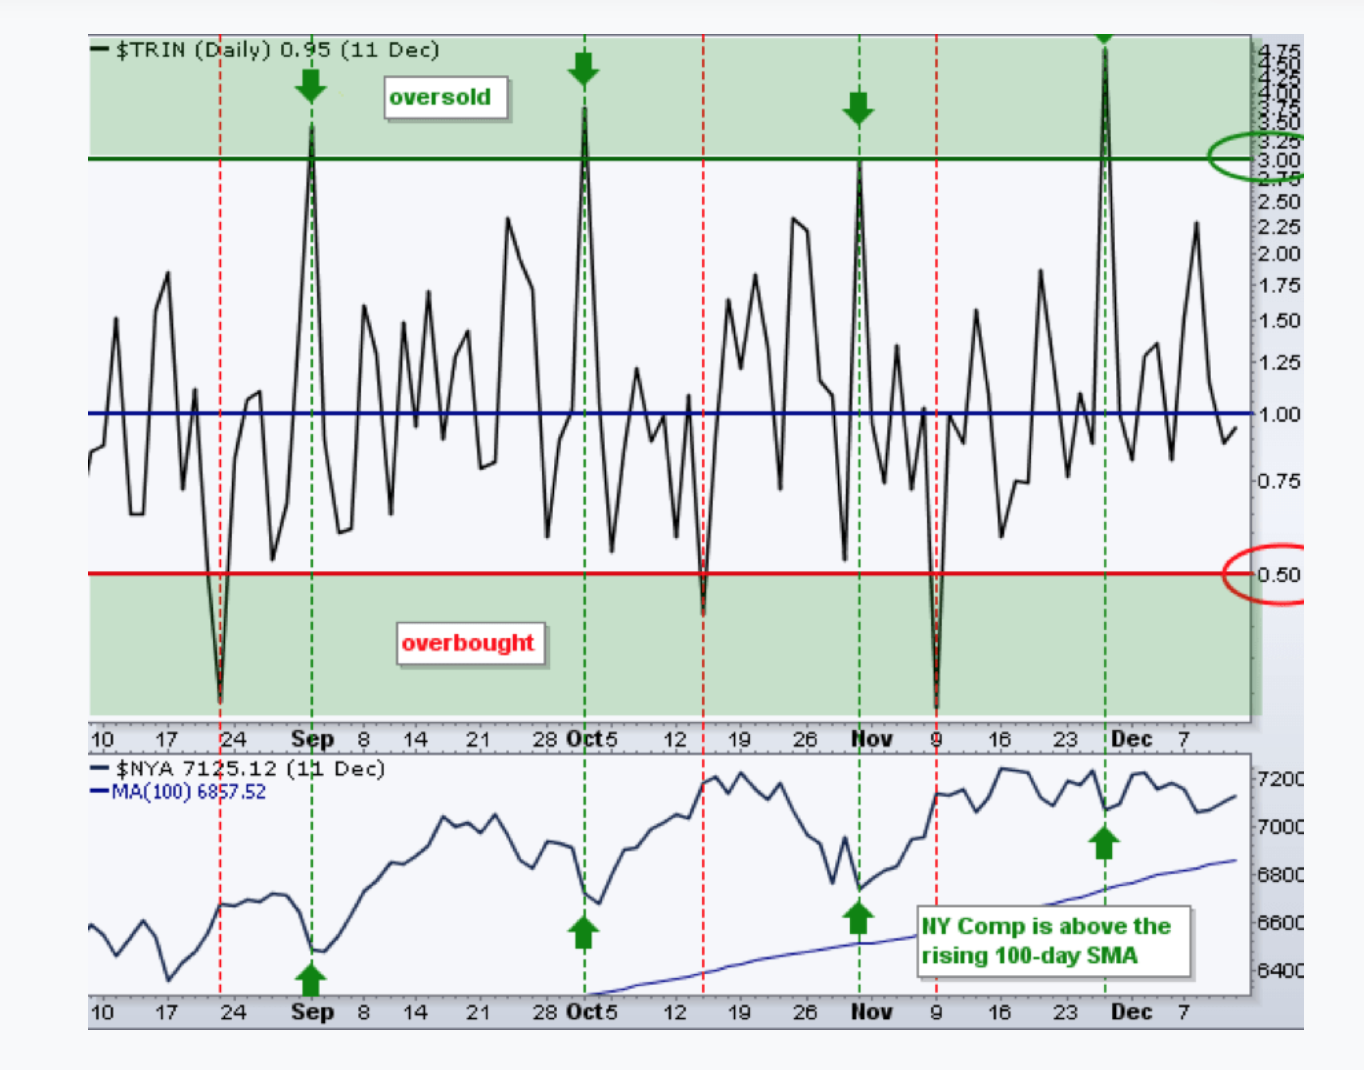
According to the example above, a rising TRIN indicates a bearish market, whereas a falling TRIN indicates a bullish market. The example above shows that the traders who bought in the market when the TRIN value was above 3.00 fared well because it was an oversold situation. The traders in the oversold situation must have got the benefit from a rise in the supply of stocks when they bought. Also, the traders who sold in the market based on values below 0.50 in which there was an overbought condition, must not have had a profitable time.
The SMA or moving average smooths the data series and makes it come into a range that is needed to generate an overbought or oversold signal or value in the market.
We will now find out the calculation of TRIN value with the help of Python codes.
Calculation of TRIN in Python
Let us see how to calculate the TRIN value with Python to analyse the condition of the market. Although if you wish, you can learn more with our blog article on building technical indicators in Python.
Coming to this calculation for TRIN value, we will first fetch the data of price and volume for the stocks. We have taken S&P500 stocks for our calculation with python code.
# Import libraries
import pandas as pd
import numpy as np
# Fetch data
def read_data(filename):
data = pd.read_csv(filename, index_col=0)
data = data.dropna()
return data
volume = read_data(‘volume.csv’)
prices = read_data(‘stock_prices.csv’)
sp500 = read_data(‘S&P 500 data.csv’)
# Print the first two rows of the prices dataframe
prices.head(2)
# Print the first two rows of the volume dataframe
volume.head(2)
# List the stock names
stocks = prices.columns
Now, we will find out if today’s close price is higher than yesterday’s close price or not. If today’s close price is higher than the previous close price, the output will show “1” and if otherwise, then the output will be “o” for the particular day. We will print this direction for one stock, that is, Amazon (AMZN) so as to see our output.
# Generate direction column for every stock with conditions if today’s close price > previous close price,
# if today’s close price < previous close price
for col in stocks:
direction_col = col + ‘_direction’
prices[direction_col] = np.where(prices[col] > prices[col].shift(1), 1, 0)
prices[direction_col] = np.where(
prices[col] == prices[col].shift(1), -1, prices[direction_col])
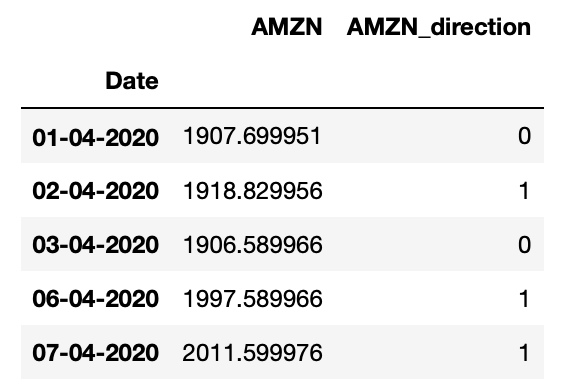
# Print the direction column for one stock
prices[[‘AMZN’, ‘AMZN_direction’]].head()
Output:
Stay tuned for the next installment in which the author will find out the number of advancing stocks.
Visit QuantInsti for additional ready-to-use code: https://blog.quantinsti.com/trin/
Disclosure: Interactive Brokers
Information posted on IBKR Campus that is provided by third-parties does NOT constitute a recommendation that you should contract for the services of that third party. Third-party participants who contribute to IBKR Campus are independent of Interactive Brokers and Interactive Brokers does not make any representations or warranties concerning the services offered, their past or future performance, or the accuracy of the information provided by the third party. Past performance is no guarantee of future results.
This material is from QuantInsti and is being posted with its permission. The views expressed in this material are solely those of the author and/or QuantInsti and Interactive Brokers is not endorsing or recommending any investment or trading discussed in the material. This material is not and should not be construed as an offer to buy or sell any security. It should not be construed as research or investment advice or a recommendation to buy, sell or hold any security or commodity. This material does not and is not intended to take into account the particular financial conditions, investment objectives or requirements of individual customers. Before acting on this material, you should consider whether it is suitable for your particular circumstances and, as necessary, seek professional advice.
Disclosure: Displaying Symbols on Video
Any stock, options or futures symbols displayed are for illustrative purposes only and are not intended to portray recommendations.