


The article “Trend Following and Momentum Turning Points” first appeared on Alpha Architect blog.
The article investigates time-series (TS) momentum strategies and their performance in financial markets based on various speeds or lookback horizons. The study aims to understand the connections between different speeds of TS momentum, unobservable variables like trend, turning points, and noise levels in realized returns, and their impact on market cycles.
Momentum Turning Points
- Goulding, Harvey and Mazzoleni
- Journal of Financial Economics
- A version of this paper can be found here
- Want to read our summaries of academic finance papers? Check out our Academic Research Insight category
What are the Research Questions?
The research questions of the article are as follows:
- What are the connections between the performance of different speeds (or lookback horizons) of time-series (TS) momentum strategies and the unobservable variables such as trend (persistence in expected returns), turning points, and noise levels in realized returns?
- How does the combination of information embedded in slow momentum (e.g., 12-month signal) and fast momentum (e.g., 1-month signal) positions help in detecting market turning points?
- How do market cycles, defined by the up or down directions of slow and fast momentum strategies, relate to the conditional behavior of average, volatility, and skewness of returns in the U.S. stock market?
- How are the macroeconomy and business cycle connected to the different market cycles identified by the slow and fast momentum strategies?
- How can dynamic strategies with speeds that vary based on observed market cycles improve performance compared to static-speed strategies?
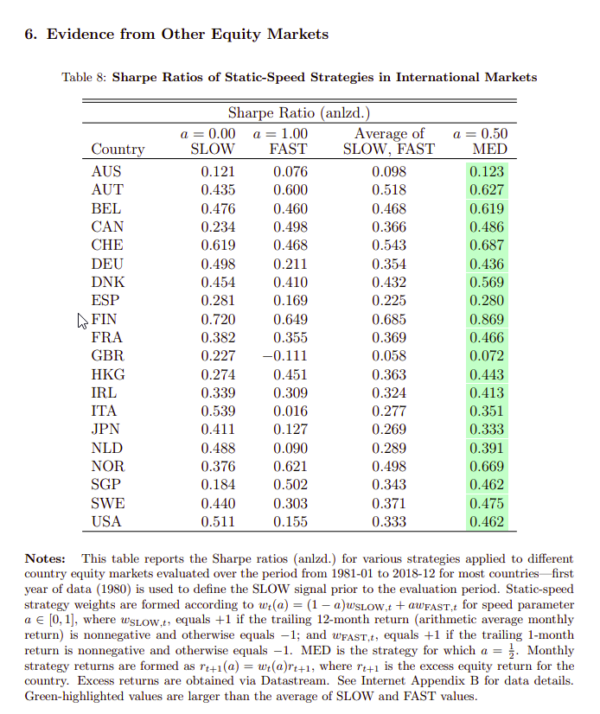
- Do the findings for the U.S. stock market regarding the performance of different speeds and dynamic strategies hold true for international equity markets as well?
What are the Academic Insights?
By examining the performance of TS momentum strategies across 20 international equity markets, the authors find:
- There are a number of connections:
- TREND: slow momentum strategies, which use longer lookback windows (e.g., 12 months), tend to outperform fast momentum strategies, which use shorter lookback windows (e.g., 1 month), in the long run. This outperformance is primarily attributed to higher persistence in expected returns. Slow momentum strategies can capture more stable trends in the market, leading to more accurate predictions of future returns
- TURNING POINTS: TS momentum strategies are prone to suffer around market turning points, which mark reversals in trend from uptrend to downtrend or vice versa. At these points, slow momentum strategies relying on past observations of realized returns are more vulnerable to placing bad bets because they mix different trend regimes and noise. On the other hand, fast momentum strategies may be more effective in the short run after turning points because they can quickly react to changing trends
- NOISE: slow momentum strategies are relatively slow to react to turning points due to their reliance on long lookback windows, which can reduce the impact of noise. However, this reduction in noise comes at the cost of potentially missing turning points (Type II error of missed detection). Conversely, fast momentum strategies with short lookback windows are more influenced by noise and are prone to false alarms (Type I error of false alarm). The trade-off between reducing noise impact and reacting quickly to turning points impacts the performance of the different speed strategies
- Combining information from both slow and fast momentum strategies can be useful in detecting market turning points. When slow and fast momentum signals disagree, it is more likely that the market is at a turning point. The agreement between the signals can indicate the market’s uptrend or downtrend phases more reliably. This combination of information enhances the accuracy of momentum strategies in capturing market trends
- Different market cycles exhibit distinct characteristics in terms of returns, volatility, and skewness, indicating the varying market conditions and potential turning points:
- During Bull states, the market experiences positive average returns with low volatility. In Bear states, the market experiences negative average returns with higher volatility.
- The Correction and Rebound states, associated with potential turning points, show deteriorating average returns and increased volatility, making the trend inference less reliable.
- Additionally, the paper suggests that the skewness of returns is scaled and shifted relative to the average skewness of slow and fast momentum strategies. The shift is in the same direction as the Sharpe ratio of the intermediate-speed momentum strategy. When the intermediate-speed strategy has a positive Sharpe ratio, its skewness is shifted towards higher (more positive, less negative) values, indicating a more favorable risk-return profile
- YES, the different market cycles identified by the slow and fast momentum strategies show distinct connections to the macroeconomy and business cycle. Bear states are associated with high macroeconomic risk, while Bull states align with positive economic news and good macroeconomic conditions. Correction and Rebound states mark potential turning points and transitional phases in the business cycle. The prevalence of Bear states early in recessions and the dominance of Bull and Rebound states later in recessionary periods indicate a connection between market cycles and different phases of the business cycle.
- Dynamic strategies with speeds that vary based on observed market cycles can improve performance compared to static-speed strategies by adapting to changing market conditions and capturing different phases of the business cycle more effectively. For example:
- Tailored Adaptation: Dynamic strategies adjust their speed or lookback horizon based on the observed market cycles. During periods of stable trends and low volatility (e.g., Bull states), the strategy may use a longer lookback window to capture persistent trends. Conversely, during periods of high volatility and potential turning points (e.g., Correction and Rebound states), the strategy may use a shorter lookback window to react quickly to changing market conditions.
- Improved Risk Management: By varying the speed of the strategy, dynamic approaches can better manage risk during volatile and uncertain market phases. Shorter lookback windows in high volatility states can reduce exposure to potential false signals and minimize the impact of noisy data. Longer lookback windows in stable trend phases can enhance the strategy’s confidence in identifying true trends and reduce the risk of missed opportunities
- Market Timing Advantage: Dynamic strategies benefit from their ability to time market cycles more effectively. By adjusting the speed based on observed market cycles, the strategy can enter and exit positions at more opportune times
- Reduced Overfitting: Static-speed strategies rely on a fixed lookback horizon, which may be optimized for historical data but could lead to overfitting to specific market conditions. In contrast, dynamic strategies adapt to changing market environments and avoid being overly optimized to past data. As a result, they are less prone to overfitting and may have better out-of-sample performance
- YES, intermediate-speed momentum strategies consistently outperform pure slow and fast momentum strategies, and dynamic strategies that adapt to market cycles are effective in capturing trends and managing risk across various countries.
Why does this study matter?
This study is important because it offers a comprehensive analysis of TS momentum strategies, its unifying framework that links performance to underlying variables, and its practical implications for investors seeking to enhance their understanding of momentum investing and improve their portfolio performance.
The Most Important Chart from the Paper:
Abstract
We use slow and fast time-series momentum to characterize four stock market cycles – Bull, Correction, Bear, and Rebound. The steep market declines of Bears concentrate in high-risk states, yet predict negative expected returns, which is difficult to rationalize by most models of time-varying risk premia. Using a model to analyze slow and fast momentum strategies, we estimate both relatively high mean persistence and realization noise in U.S. stock market returns. Intermediate-speed momentum portfolios, formed by blending slow and fast momentum strategies, translate predictive information in market cycles into positive unconditional alpha, for which we propose a novel decomposition.
Disclosure: Alpha Architect
The views and opinions expressed herein are those of the author and do not necessarily reflect the views of Alpha Architect, its affiliates or its employees. Our full disclosures are available here. Definitions of common statistics used in our analysis are available here (towards the bottom).
This site provides NO information on our value ETFs or our momentum ETFs. Please refer to this site.
Disclosure: Interactive Brokers
Information posted on IBKR Campus that is provided by third-parties does NOT constitute a recommendation that you should contract for the services of that third party. Third-party participants who contribute to IBKR Campus are independent of Interactive Brokers and Interactive Brokers does not make any representations or warranties concerning the services offered, their past or future performance, or the accuracy of the information provided by the third party. Past performance is no guarantee of future results.
This material is from Alpha Architect and is being posted with its permission. The views expressed in this material are solely those of the author and/or Alpha Architect and Interactive Brokers is not endorsing or recommending any investment or trading discussed in the material. This material is not and should not be construed as an offer to buy or sell any security. It should not be construed as research or investment advice or a recommendation to buy, sell or hold any security or commodity. This material does not and is not intended to take into account the particular financial conditions, investment objectives or requirements of individual customers. Before acting on this material, you should consider whether it is suitable for your particular circumstances and, as necessary, seek professional advice.
Join The Conversation
If you have a general question, it may already be covered in our FAQs. If you have an account-specific question or concern, please reach out to Client Services.