


")


This week will be all about price inflation, with the CPI, PPI, and import/export price reports. CPI is expected to rise by 0.3% m/m, down from 0.4%, while increasing by 3.4% y/y, up from 3.2%. Meanwhile, core CPI is expected to rise by 0.3% m/m, down from 0.4%, and increase by 3.7% y/y, down from 3.8%.
CPI swaps expect CPI to be 3.4% y/y and 0.3% m/m, which is in line with consensus estimates.
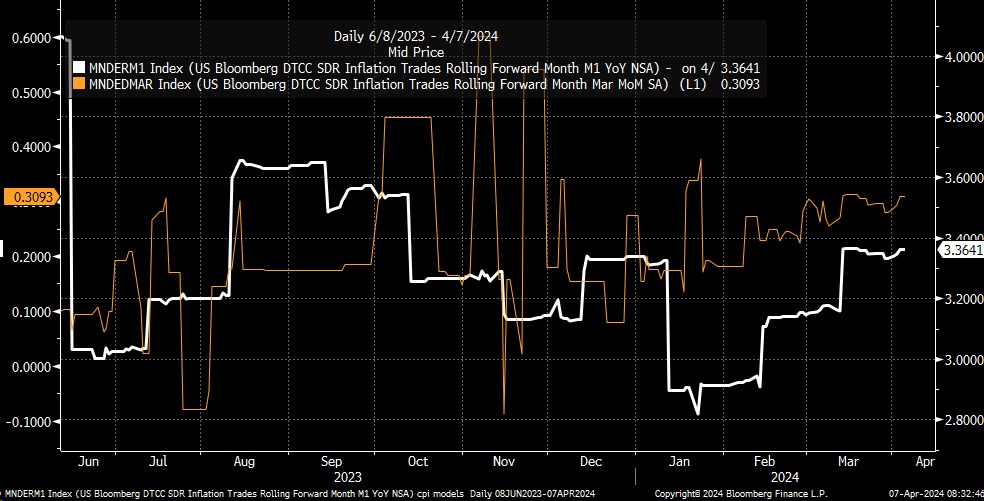
The CPI number has been hotter than analysts’ median estimates, and the CPI swap pricing for a few months now. Going back to July, the CPI report has come in below CPI swap pricing only once in November.

So, another hot headline number wouldn’t be good and likely continue to drive higher rates across the Treasury curve. Last week, following the robust jobs data, the 2-year yield finished the week higher at 4.75%, while the 10-year rate pushed to 4.4%.
The 2-year yield appears to have formed a long-term cup and handle pattern and is now on the verge of breaking out of that pattern, with the potential for the rate to rise to around 5.1%. It may sound surprising to hear that the 2-year rate could rise this high from a fundamental basis, but let’s face facts, given the latest round of job data and expectations based on CPI swap pricing with the y/y rate expected to remain around 3.2% for the next few months, it would make sense for more rate cuts to be removed from market pricing, resulting in a higher 2-year rate.

Additionally, we are seeing the “Powell” indicator, which is simply the 3-month Treasury bill spot rate minus the 3-month Treasury Bill 18-month forward rate rise to -91 basis points. That is the highest it has been since late November. It has been steadily rising as the 3-month Treasury bill 18-month forward rate rises to the spot rate, which is just another way to see how the market is removing rate cuts from the overall equation.

The 10-year rate has a short-term cup and handle pattern, which has broken out. The rate crossed above key resistance at 4.35% to finish the week at 4.4%. At this point, it seems possible for the rate to rise to around 4.5%, if not higher.

Meanwhile, the spreads between US overnight rate expectations and those of other central banks continued to widen, and this widening should drive the dollar higher in the coming weeks, especially if US data points to a higher for longer monetary policy stance from the Fed.

Also, we are seeing longer-end spread widening, such as those between the US 10-year and the German 10-year, which appears to have broken out of a bull flag. This suggests that the dollar should strengthen further from here as the spread widens further. The 2% region has been a big area of resistance for this spread, and a move above that level should lead to significant widening, potentially to around 2.3% or higher.

A wider spread should lead to the dollar strengthening versus the euro. With support for the euro currently at 1.07, it could lead to the euro seeing a significant breakdown versus the dollar and potentially sending the euro back to parity versus the dollar.

Wider spreads are likely to lead to wider spreads on High-yield debt as well, and that has already started to happen with the CDX high-yield index rising to 340 this past week.

The combination of higher rates, a stronger dollar, and wider credit spreads should lead to tighter financial conditions and lower equity valuations. How low will depend on how far financial conditions tigthen, and based on the current economic data, one would think that conditions would need to tigthen a lot.
While one may walk away with the impression that the equity market didn’t care about the jobs data, remember what was discussed on Thursday regarding the move higher in 1-day implied volatility levels and the volatility crush that was likely to follow, and that was what Friday’s “rally” was about. It wasn’t in celebration of a strong job number; it was merely due to the reset in volatility, in the same manner in which we saw the after the CPI report on March 11 and Nvidia’s results on February 21.

A good part of the Nvidia rally was given back in the following days, and the entire CPI rally was given back in the NASDAQ. What was also noticeable on Friday was that the Nasdaq tried for a third day in a row to get above the 10-day exponential moving average and failed, closing below it for the fourth day in a row. It seems clear at this point that the moving average is serving as resistance. If we have formed a diamond pattern on the Nasdaq, which it appears to be, then I would expect to see the Nasdaq undercut the low from February 21 at 17,330.

The S&P 500 closed right at the 10-day exponential moving average and has now struggled at that level for four days in a row, suggesting a potential change in trend for the index. Plus, the significant uptrend in the index has broken down from the October lows. At the end of October, the index was trading at 4,100 when a rally commenced that seemed to make no sense, built on the easing of financial conditions and systematic flows. I see no reason why we can’t return to that level over the next few months as financial conditions tighten, triggering systematic selling flows.

Meanwhile, Nvidia is flirting with the $850 level as of last week, and a break of the $850 level would set up that double-top bearish engulfing pattern in the shares and potentially create the opportunity for the stock to retrace lower, filling the gap at $675.

Have a great week.
—
Originally Posted April 7, 2024 – A Hot CPI Report This Week May Send Rates and Dollar Surging
Charts used with the permission of Bloomberg Finance L.P. This report contains independent commentary to be used for informational and educational purposes only. Michael Kramer is a member and investment adviser representative with Mott Capital Management. Mr. Kramer is not affiliated with this company and does not serve on the board of any related company that issued this stock. All opinions and analyses presented by Michael Kramer in this analysis or market report are solely Michael Kramer’s views. Readers should not treat any opinion, viewpoint, or prediction expressed by Michael Kramer as a specific solicitation or recommendation to buy or sell a particular security or follow a particular strategy. Michael Kramer’s analyses are based upon information and independent research that he considers reliable, but neither Michael Kramer nor Mott Capital Management guarantees its completeness or accuracy, and it should not be relied upon as such. Michael Kramer is not under any obligation to update or correct any information presented in his analyses. Mr. Kramer’s statements, guidance, and opinions are subject to change without notice. Past performance is not indicative of future results. Neither Michael Kramer nor Mott Capital Management guarantees any specific outcome or profit. You should be aware of the real risk of loss in following any strategy or investment commentary presented in this analysis. Strategies or investments discussed may fluctuate in price or value. Investments or strategies mentioned in this analysis may not be suitable for you. This material does not consider your particular investment objectives, financial situation, or needs and is not intended as a recommendation appropriate for you. You must make an independent decision regarding investments or strategies in this analysis. Upon request, the advisor will provide a list of all recommendations made during the past twelve months. Before acting on information in this analysis, you should consider whether it is suitable for your circumstances and strongly consider seeking advice from your own financial or investment adviser to determine the suitability of any investment.
Join The Conversation
If you have a general question, it may already be covered in our FAQs. If you have an account-specific question or concern, please reach out to Client Services.
Leave a Reply
Disclosure: Mott Capital Management
Mott Capital Management is the portfolio manager for one portfolio offered by Interactive Advisors. Interactive Advisors clients do not invest directly with the Portfolio Managers like Mott Capital Management, and the Managers do not have discretionary trading authority over Interactive Advisors client accounts. The Portfolio Managers on the Interactive Advisors platform simply license their trade data to Interactive Advisors, which then allows its clients to have the same strategy and trading decisions mirrored in their accounts if the Portfolio is in line with their risk score. Portfolio Managers like Mott Capital Management implement their trading philosophy and strategy without knowing the identity of Interactive Advisors’ clients or taking into account these clients’ individualized circumstances.
Mott Capital Management has entered into a Portfolio Manager License Agreement with Interactive Advisors pursuant to which it provides trading data IA uses to offer a portfolio to its investment advisory clients. Mott Capital Management is not affiliated with any entities in the Interactive Brokers Group.
Interactive Advisors is an affiliate of Interactive Brokers LLC.
Pursuant to the Investment Management Agreement between Interactive Advisors and its clients, all brokerage transactions occur through Interactive Brokers LLC, an affiliate of Interactive Advisors. The use of an affiliate for brokerage services represents a potential conflict of interest as Interactive Brokers LLC is paid a commission on trades executed on behalf of Interactive Advisors. Interactive Brokers LLC does not consider this conflict material as it does not sell, solicit, recommend, trade against or otherwise attempt to induce Interactive Advisors to place any orders in any products. Interactive Advisors does not offer services through any other broker-dealer. All trading by Interactive Advisors is self-directed. Interactive Advisors clients acknowledge this potential conflict of interest and authorize Interactive Advisors to execute transactions through Interactive Brokers LLC when they open an Interactive Advisors account. Clients should consider the commissions and other expenses, execution, clearance, and settlement capabilities of Interactive Brokers LLC as a factor in their decision to invest in an Interactive Advisors Portfolio. Interactive Advisors believes it satisfies its best execution obligation by trading its clients’ trades through Interactive Brokers LLC. While there can be no assurance that it will in fact achieve best execution, Interactive Advisors does periodically monitor the execution quality of transactions to ensure that clients receive the best overall trade execution pursuant to regulatory requirements.
Disclosure: Interactive Brokers
Information posted on IBKR Campus that is provided by third-parties does NOT constitute a recommendation that you should contract for the services of that third party. Third-party participants who contribute to IBKR Campus are independent of Interactive Brokers and Interactive Brokers does not make any representations or warranties concerning the services offered, their past or future performance, or the accuracy of the information provided by the third party. Past performance is no guarantee of future results.
This material is from Mott Capital Management and is being posted with its permission. The views expressed in this material are solely those of the author and/or Mott Capital Management and Interactive Brokers is not endorsing or recommending any investment or trading discussed in the material. This material is not and should not be construed as an offer to buy or sell any security. It should not be construed as research or investment advice or a recommendation to buy, sell or hold any security or commodity. This material does not and is not intended to take into account the particular financial conditions, investment objectives or requirements of individual customers. Before acting on this material, you should consider whether it is suitable for your particular circumstances and, as necessary, seek professional advice.


Referencing the Disclosure Mott Capital Management, paragraph 1, sentence 2, “if their portfolio is in line with their risk score,” what are the risk score questions, and the risk score questions grading points, and the risk score summary scales?
Thank you.