


")


By Todd Stankiewicz CMT, CFP, ChFC
1/ US Retail Sales
2/ Investor Sentiment
3/ Has the S&P 500 Capitulated?
Investopedia is partnering with CMT Association on this newsletter. The contents of this newsletter are for informational and educational purposes only, however, and do not constitute investing advice. The guest authors, which may sell research to investors, and may trade or hold positions in securities mentioned herein do not represent the views of CMT Association or Investopedia. Please consult a financial advisor for investment recommendations and services.
1/ US Retail Sales

It has been said that retail sales are one of the most important indicators of economic growth. They also directly influence the S&P 500 Consumer Discretionary (S5COND) and Consumer Staples Sectors (S5CONS). This chart plots the US Retails Sales, the year-over-year growth of retail sales, and subsequently the charts of the S&P 500 Consumer Staples and Consumer Discretionary Sectors.
While US Retail sales continue to grow to record numbers, the year-over-year growth has dropped dramatically to just 1.63%. Historically, dips in retail sales growth have been correlated with drops in the Consumer Discretionary Sector and the Consumer Staples sectors. The volatility of the respective sectors increases even further when the year-over-year change in retail sales turns negative.
We have recently seen a big spike in the consumer discretionary sector despite retails sales growth continuing to hover around very low levels. This divergence suggests that if retail sales do not see a surge in growth, the consumer discretionary sector may revert to its traditional correlation and fall back in line.
If retail sales do in fact turn negative, consumer staples may offer a more favorable risk reward relative to consumer discretionary based on the lower volatility during these periods. So, it may make sense to pay close attention to retail sales data going forward to help determine if any adjustment to your portfolio is necessary for the prevailing market conditions.
2/ Investor Sentiment

There is a famous quote by Warren Buffet, “Be Fearful when others are greedy, and be greedy when others are fearful.” One way to measure fear and greed in the market with the AAII Investors Sentiment Survey. This weekly survey measures the difference between the bullish and bearish outlook over the next 6 months of survey respondents. The market is fearful when this data point is negative, indicating there are more bears than bulls. In line with Buffet’s quote, it serves as a contrarian indicator.
On July 19 the spread was positive 29.9% in favor of the bulls. This spread continued strongly through August 2 at 27.7%. These were the highest levels since 2021, suggesting market participants were very optimistic. Throughout the past few years, it can be observed that extreme bullish levels correlated to short term peaks. Conversely, extreme negative levels are often associated with market bottoms, even if they are just short-term opportunities in some cases.
Since early August, we have seen the indices pull back quite substantially. As a result, the AAII investor sentiment has once again turned negative. Based on history, this may suggest that there is short term opportunity in the S&P 500 Index.
There is another famous, “The trend is your friend.” So, remember, always view these indicators in the context of whichever trend is appropriate for your time horizon.
3/ Has the S&P 500 Capitulated?

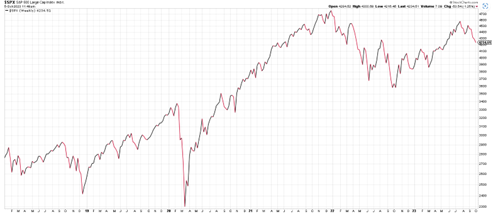
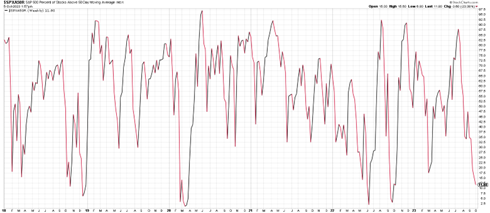
In line with the contrarian theory regarding Investor sentiment, there are different indicators we can use to extrapolate if the market has in fact capitulated. These two indicators are looking at the percent of stocks above the 200-day moving average (Top Chart) and the percentage for stocks above the 50-day moving average (Bottom Chart). The middle chart is the S&P50 index.
Two different moving average levels need to be observed to create context around the possibility of short-term vs long-term capitulation events. The percentage of stocks above the 50 day represents short term capitulation, while the percentage of stocks above the 200-day moving average represents long term capitulation.
The percentage of stocks above the 50-day moving average has dropped to 11.8%. This is far from the lows of under 5% that we saw in March of 2020 or during June and September of 2022, but it is the fifth lowest reading since January 2018. Each of these events represented short-term lows in the market.
When we look at the longer-term trend of the stocks above the 200-day moving average, the reading is not as extreme as the 50-day average level. This suggests that we may only be experiencing a short-term bottom, the longer-term low may not yet be in. As such, we will continue with the theme this week; be patient, flexible, and objective. Filter through the noise and listen to the signals.
—
Originally posted 6th October 2023
Disclosure: Investopedia
Investopedia.com: The comments, opinions and analyses expressed herein are for informational purposes only and should not be considered individual investment advice or recommendations to invest in any security or to adopt any investment strategy. While we believe the information provided herein is reliable, we do not warrant its accuracy or completeness. The views and strategies described on our content may not be suitable for all investors. Because market and economic conditions are subject to rapid change, all comments, opinions and analyses contained within our content are rendered as of the date of the posting and may change without notice. The material is not intended as a complete analysis of every material fact regarding any country, region, market, industry, investment or strategy. This information is intended for US residents only.
Disclosure: Interactive Brokers
Information posted on IBKR Campus that is provided by third-parties does NOT constitute a recommendation that you should contract for the services of that third party. Third-party participants who contribute to IBKR Campus are independent of Interactive Brokers and Interactive Brokers does not make any representations or warranties concerning the services offered, their past or future performance, or the accuracy of the information provided by the third party. Past performance is no guarantee of future results.
This material is from Investopedia and is being posted with its permission. The views expressed in this material are solely those of the author and/or Investopedia and Interactive Brokers is not endorsing or recommending any investment or trading discussed in the material. This material is not and should not be construed as an offer to buy or sell any security. It should not be construed as research or investment advice or a recommendation to buy, sell or hold any security or commodity. This material does not and is not intended to take into account the particular financial conditions, investment objectives or requirements of individual customers. Before acting on this material, you should consider whether it is suitable for your particular circumstances and, as necessary, seek professional advice.


Join The Conversation
If you have a general question, it may already be covered in our FAQs. If you have an account-specific question or concern, please reach out to Client Services.