

")


1/ The Market is Saying it: Inflation is Here to Stay
2/ Catching Up or Leaving it Behind?
3/ It’s Getting Late…in the Cycle
Investopedia is partnering with CMT Association on this newsletter. The contents of this newsletter are for informational and educational purposes only, however, and do not constitute investing advice. The guest authors, which may sell research to investors, and may trade or hold positions in securities mentioned herein do not represent the views of CMT Association or Investopedia. Please consult a financial advisor for investment recommendations and services.
1/ The Market is Saying it: Inflation is Here to Stay
As much as the U.S. Government wants to minimize it, and as much as the Fed wants to deny that it’s a problem, the average consumer knows the truth about it. Inflation is not over. But if you need some convincing (there’s a finger pointing at you Fed Governors), just check out the chart below which compares Blackrock backed iShares’ 3-7 Year Treasury Bond ETF (IEI) to its Treasury Inflation Protected Securities Bond ETF (TIP).
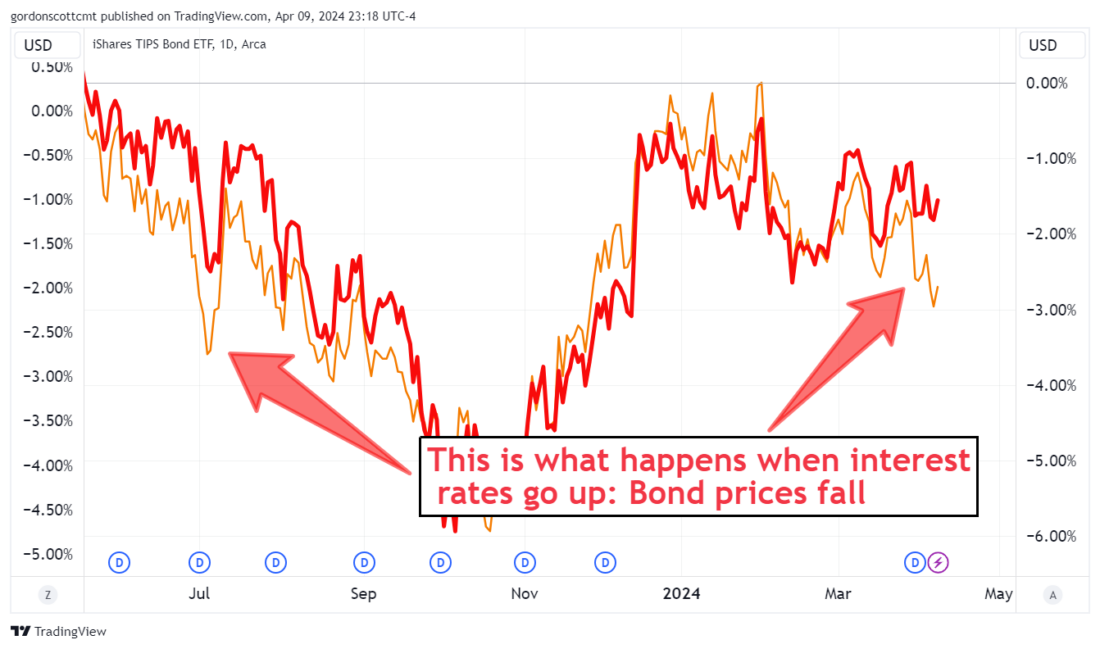
These two lines represent the difference between a bond fund that is protected against inflation (TIP, the red line), and a bond fund of similar duration that is not (IEI, the orange line). Notice how the orange line is dipping lower, leaving the red line behind. This happened before, last year, as market-driven interest rates (not the Fed’s overnight rate) rose and the price of this bond fund dipped below its inflation-protected equivalent.
Bond prices are inversely correlated to bond rates, so the fact that the orange line is dropping means rates are going up. Rates are going up because investors demand higher rates as protection against…you guessed it: inflation.
As of this writing the market is anticipating that the CPI numbers will reflect a poor showing of monetary policy in the battle of interest rates vs. inflation. However, by the time you read this, it will be either confirmed or denied by the market’s opening price action.
2/ Catching Up or Leaving it Behind?
When inflation shows up, historically, investors have sought out ways to buy and hold precious metals as a hedge. Some have speculated that this time around Bitcoin might take a turn at playing the role of the stored value security. The chart below makes a compelling case that investors are looking at the gold-logo-bearing digital oddity at least similarly to the digital equivalent of gold, World Gold Council’s SPDR Gold Index ETF (GLD).

Two items of interest jump out from this chart. First, the price of Bitcoin is behaving suspiciously similarly to the price of gold, right up until the past two weeks as GLD makes a second spectacular run higher. The second is the fact that Bitcoin has been sideways for a month or more making it possible for GLD to catch up.
Will Bitcoin and GLD both make a run higher from here? Or will the latter leave the former behind. Unless inflation cools down, both are likely to continue going higher.
3/ It’s Getting Late…in the Cycle
The idea that inflation is stubbornly hanging around might have less to do with monetary policy and more to do with the interplay between market cycles and economic cycles. This model was developed by Sam Stoval and published in his 1996 work, Standard & Poor’s Sector Investing: How to Buy The Right Stock in The Right Industry at The Right Time.
This sector rotation model presupposes that a rising market leads to higher prices which eventually cause investors to shift their investing targets. Investors move from technology to industrials and ultimately to energy stocks as the bull market peaks (see chart below).
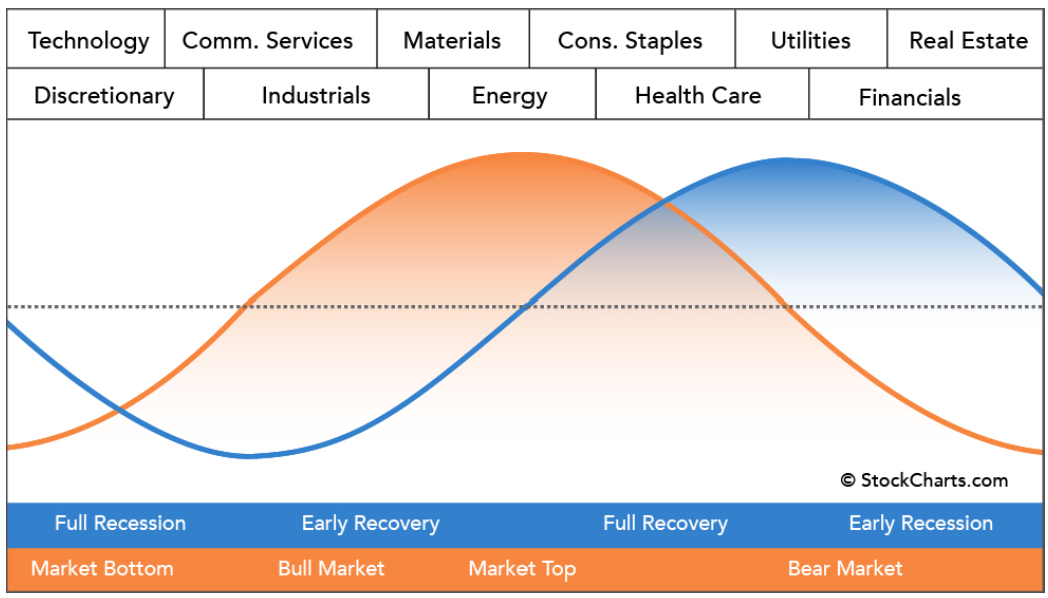
Courtesy of StockCharts.com
This makes sense because higher demand for production resources increases the price of things like basic materials or energy. Perhaps it is not surprising that the most recent overlay of sector performance shows that over the past three months the Energy sector is leading all others in performance (see chart below).

Courtesy of StockCharts.com
When the market cycle tops out, it is often because the price of goods and services has become more expensive than consumers can broadly afford. When this dynamic begins to cut into corporate profits, share prices inevitably retreat. Could it be that this cycle is playing out yet again and that a pullback in market prices is on the horizon?
Originally posted on April 10, 2024
Disclosure: Investopedia
Investopedia.com: The comments, opinions and analyses expressed herein are for informational purposes only and should not be considered individual investment advice or recommendations to invest in any security or to adopt any investment strategy. While we believe the information provided herein is reliable, we do not warrant its accuracy or completeness. The views and strategies described on our content may not be suitable for all investors. Because market and economic conditions are subject to rapid change, all comments, opinions and analyses contained within our content are rendered as of the date of the posting and may change without notice. The material is not intended as a complete analysis of every material fact regarding any country, region, market, industry, investment or strategy. This information is intended for US residents only.
Disclosure: Interactive Brokers
Information posted on IBKR Campus that is provided by third-parties does NOT constitute a recommendation that you should contract for the services of that third party. Third-party participants who contribute to IBKR Campus are independent of Interactive Brokers and Interactive Brokers does not make any representations or warranties concerning the services offered, their past or future performance, or the accuracy of the information provided by the third party. Past performance is no guarantee of future results.
This material is from Investopedia and is being posted with its permission. The views expressed in this material are solely those of the author and/or Investopedia and Interactive Brokers is not endorsing or recommending any investment or trading discussed in the material. This material is not and should not be construed as an offer to buy or sell any security. It should not be construed as research or investment advice or a recommendation to buy, sell or hold any security or commodity. This material does not and is not intended to take into account the particular financial conditions, investment objectives or requirements of individual customers. Before acting on this material, you should consider whether it is suitable for your particular circumstances and, as necessary, seek professional advice.


Join The Conversation
If you have a general question, it may already be covered in our FAQs. If you have an account-specific question or concern, please reach out to Client Services.