


(Two theme songs for today: “I Want It All” – Queen; “Epic” – Faith No More)
The options market got it largely right, but I didn’t.
Yesterday we wrote that zero-dated S&P 500 Index (SPX) options were pricing in a 1.8% move, and while the index “only” managed a roughly 1.4% gain, I’ll assert that they did a reasonable job at pricing in the eventual post-FOMC rally. But I confess to misreading Chair Powell’s intentions. Although I offered what seemed to be a balanced assessment of what might occur if the “dot plot” came up short of market expectations, I grossly underestimated how the market nonetheless considers it great news.
The November meeting did not feature a “dot plot,” the colloquial name for the FOMC’s Summary of Economic Projections (SEP). In September, the median Fed Funds rate projection for the end of 2024 was 5.125%. That hardly squares with the 4.26% that is currently estimated by futures markets. (Though it is indeed up from last week’s 4.07%) A dot plot that falls well short of current projections could certainly spook markets, and unless Powell is willing to disavow his colleagues’ projections, he will need to spend a fair amount of the press conference explaining why the FOMC’s views are so far off the market’s.
Ask yourself, which has the greater likelihood? That the FOMC and Powell will reaffirm the market’s rosy assumptions about rate cuts, or whether they will reassert that while we have made great progress against inflation, we have not yet achieved the 2% objective, and thus it is premature to consider rate cuts until that occurs. If the former, then by all means remain sanguine about risk assets. If the latter, perhaps some risk aversion seems prudent.
Yesterday’s dot plot added the expectation for an additional cut in 2024, taking the median projection from 5.125% to 4.625%. That is indeed a major change to the path of rates anticipated by the FOMC members, and the markets rightly viewed that as a key change in sentiment about future rate policy. But that still came up well short of the 4.26% that was anticipated earlier this week. Traders focused much more on the message sent about rates in the near term than the rates themselves.
Oh, and how did Fed Funds futures adjust to the new rate projections? They went from projecting 4 or 5 cuts in 2024 to more than 6. Almost two weeks ago, we wondered whether markets had “outkicked the coverage” in anticipating rate cuts more aggressively than the Fed was willing to offer. Well, if that was a concern before, then it must remain one now. The dot plot projects 4.625% while Fed Funds project 3.78% for the December meeting.
Rates traders are nothing if not consistent. They have been underestimating longer term rates for quite some time. After last December’s meeting, the one that triggered an end-of-year selloff, rates were projected to have peaked in May at 4.87% followed by cuts that were projected to have Fed Funds at 4.34% today. But it didn’t matter anyway.
Considering the enthusiastic change in projected short-term rates, it is understandable why we saw such a dramatic drop in rates across the yield curve. Rates on 2-year Treasuries fell by 30 basis points and are a further 10bp lower today. That is a stunning fall, from 4.73% to 4.33% in less than 24 hours. Over that same period, 10-year rates have fallen by “only” 30bp – a stunning move nonetheless.
But here’s the curious part – the yield curve remains inverted. If we were expecting a soft landing, where growth continues at a modest pace, we would expect the yield curve to normalize. Instead, the inversion increased. The SEP showed a modest dip in projected real GDP growth for 2024, to 1.4% from September’s 1.5%. Could it be that investors believe that we might enter a recession before recovering? The FOMC projections are not granular enough to project that with any certainty, but the bond market is still showing obvious concerns about a deeper recession via an inversion that would qualify as among the largest in nearly 40 years:
2-Year Treasury Yields Minus 10-Year Treasury Yields Since 1985, Monthly Bars. NBER Recession Starts Marked in Red, Recession Ends Marked in Green
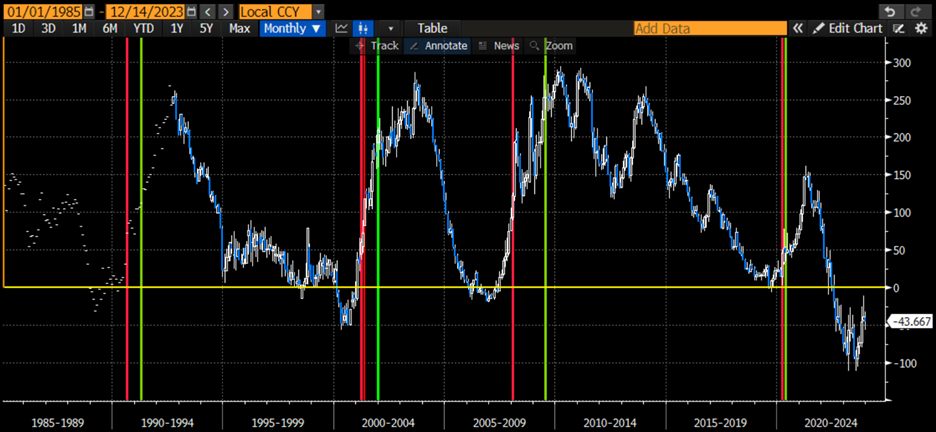
Source: Bloomberg
It’s quite clear that rather than being a Grinch, or even Goldilocks, Powell took on the role of Santa Claus yesterday, offering rhetorical Christmas presents to traders who were already expecting a nice haul. The contrarian in me is nagged by the feeling that we could be so enthused that we are setting up a situation similar to that of late 2021 into early 2022, when SPX peaked on the first trading day of the new year and sank throughout. It’s a concern that I raised during an event yesterday, while markets were furiously rallying. We’re in a seasonally favorable period and the most bullish bets have been among the most profitable for the past six weeks, if not all of 2023. Markets will eventually need to resolve whether the yield curve’s inversion is indeed a more ominous sign about the economy, but probably not for another couple of weeks. Why spoil a great holiday party?
Join The Conversation
If you have a general question, it may already be covered in our FAQs. If you have an account-specific question or concern, please reach out to Client Services.
Leave a Reply
Disclosure: Interactive Brokers
The analysis in this material is provided for information only and is not and should not be construed as an offer to sell or the solicitation of an offer to buy any security. To the extent that this material discusses general market activity, industry or sector trends or other broad-based economic or political conditions, it should not be construed as research or investment advice. To the extent that it includes references to specific securities, commodities, currencies, or other instruments, those references do not constitute a recommendation by IBKR to buy, sell or hold such investments. This material does not and is not intended to take into account the particular financial conditions, investment objectives or requirements of individual customers. Before acting on this material, you should consider whether it is suitable for your particular circumstances and, as necessary, seek professional advice.
The views and opinions expressed herein are those of the author and do not necessarily reflect the views of Interactive Brokers, its affiliates, or its employees.


Hi, the title should be reversed: 10-Year Treasury Minus 2-Year Treasury.
Very good pieces of writing, insightful and also entertaining. I bet AI would never be able to pen anything even close!
Thank you!
Hello LN, we appreciate your question. The bars (which start as dots because of less data) is the 2-10 spread, calculated by subtracting the yield on 10-year US Treasury notes from their 2-year counterparts. Most of the time that spread is greater than zero; when it is negative, as it is now, the yield curve is said to be inverted. We hope you continue to enjoy Traders’ Insight!