

")


During my career as a trader, I necessarily developed a short-term view of markets. It’s always important to have a long-term view about key financial assets, and specifically one’s investments, but it’s also all too easy to lose sight of the “big picture” when focused primarily on short-term concerns. This weekend I was offered a different perspective[i] – the long-term view – and it certainly clarified my views about how the current market environment fits into broader market trends.
The simplest way to do this is to simply display some long-term charts of monthly data, updated through today. Some reveal outperformance, others underperformance, others show potential turning points. In a departure from our normal format, where we clearly label each graph’s content, I will instead hide key data until the end. This will hopefully remove some of the biases that one might have regarding the underlying stock or index that is displayed.
All charts are sourced from the IBKR Trader Workstation using the maximum number of one-month bars available, along with the 12-month moving average in the top section, the 12-month RSI in the middle section, and the 14,3 Slow Stochastics in the bottom section. None of the items displayed are obscure – they’re all well-known investments.
In this first chart, we include the price in the Y-axis so that you can see how the supporting studies are displayed. Since the chart areas for the middle and bottom sections don’t change, we will begin leaving out the Y-axis label afterwards.
Frequent readers of this column should have little trouble identifying the product displayed below. With a tendency to reside in the high teens and no long-term appreciation, it should be apparent that it displays the Cboe Volatility Index (VIX). One can look at the higher lows of the past couple of months and the upturn in the stochastics and consider whether we should be trading VIX from the long side rather than the short side. As you likely know already, I take the former view right now.

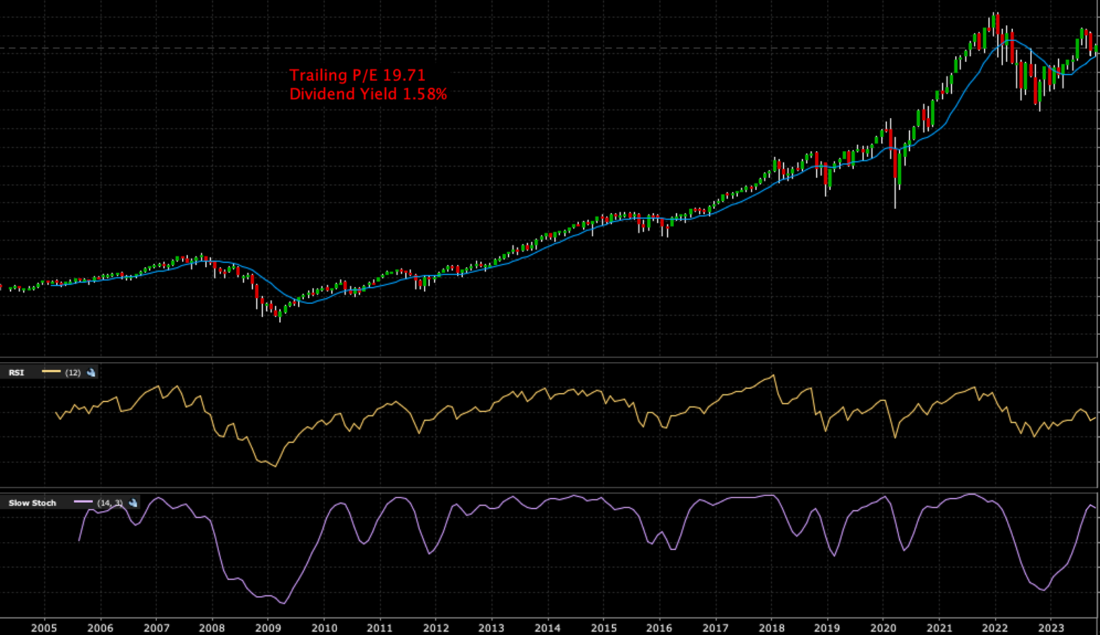
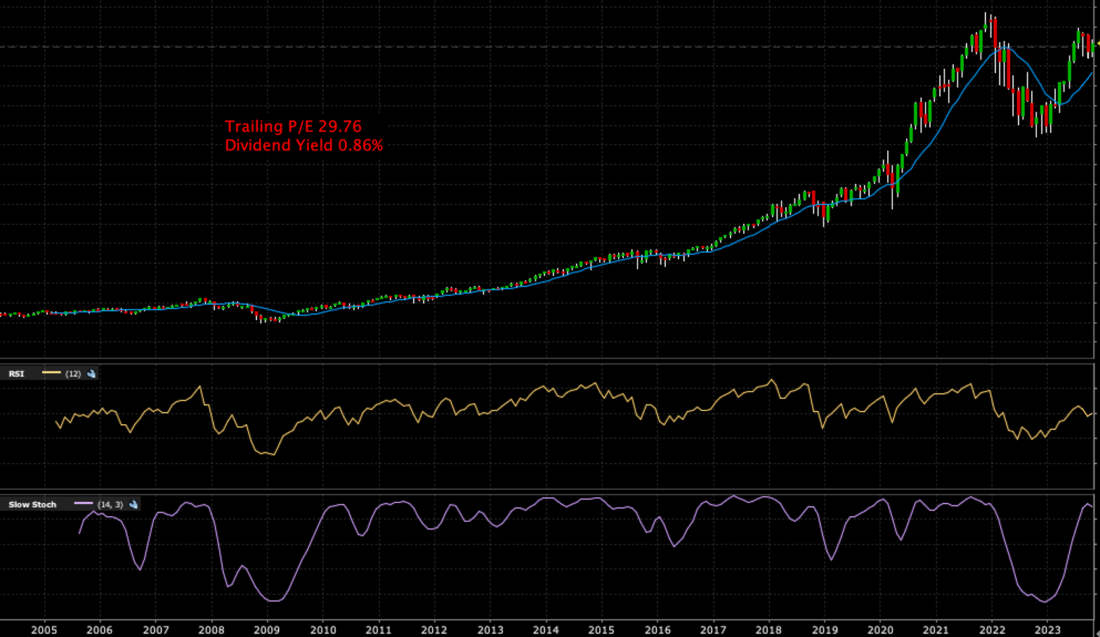
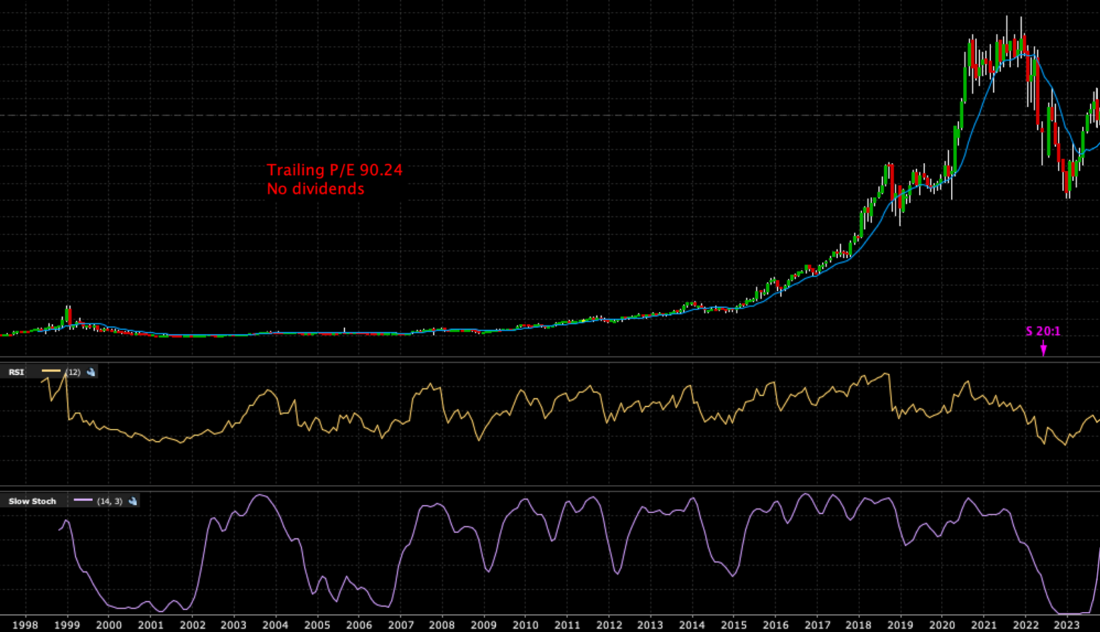
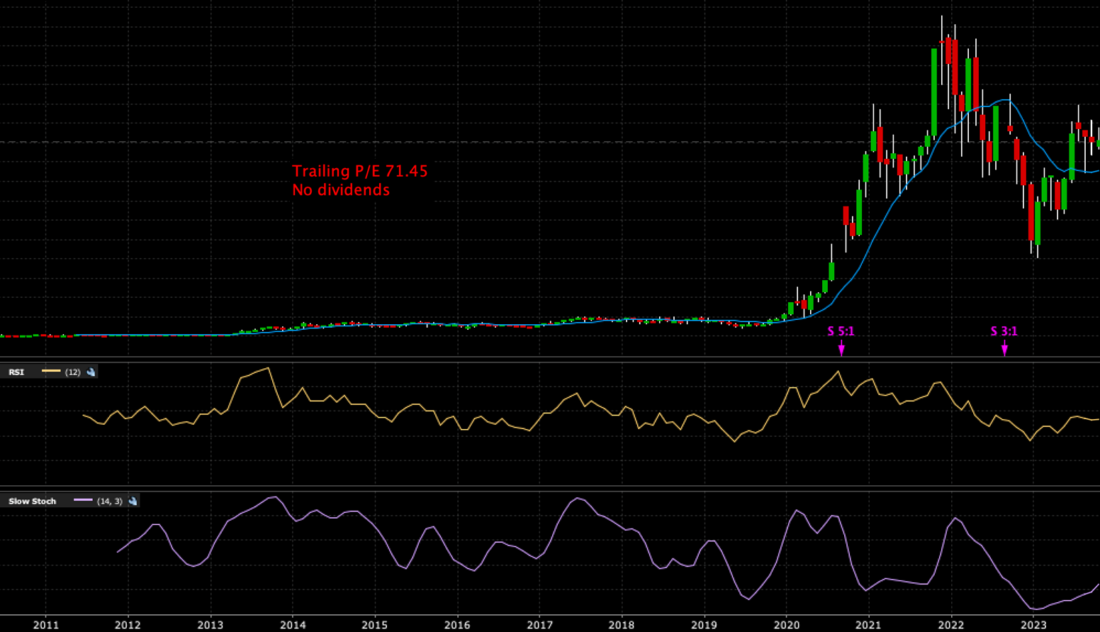
Now we will display a series of graphs, leaving the X-axis label intact (the dates are not constant) and adding the item’s P/E and dividend yield (where appropriate). The next two graphs show items that have attempted to recoup recent highs and have fallen short so far. Their RSI readings fail to confirm those of their prior highs – and those readings also fell short of their prior highs – while we have seen lower highs recently and stochastics that are turning south. A key difference is that the former item is riding along its 12-month moving average while the latter remains well above it:
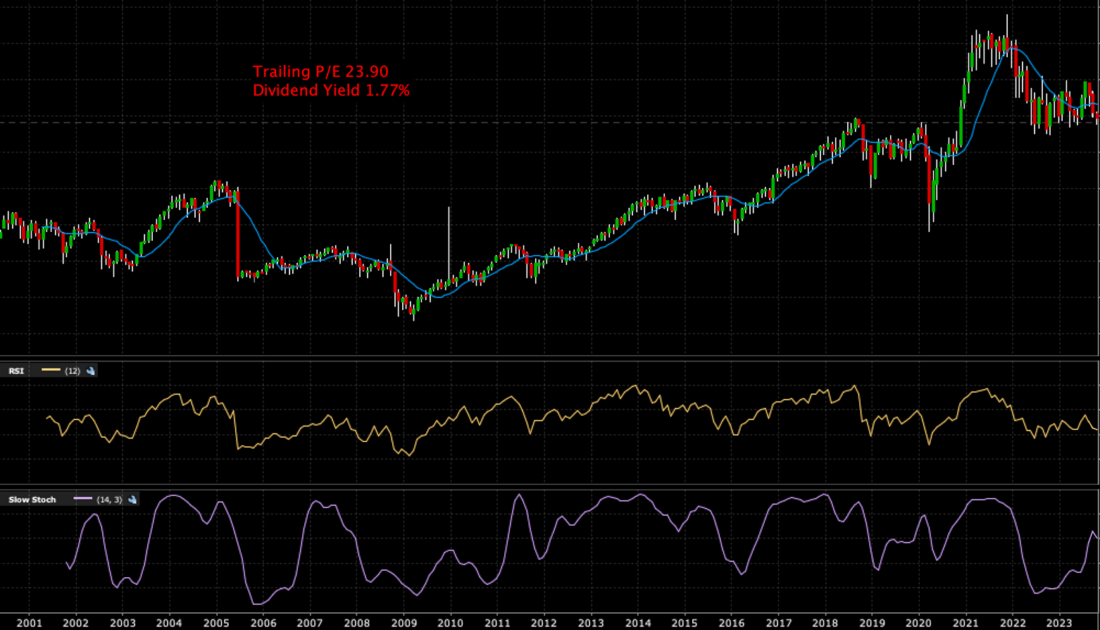
The next item is curious. It didn’t rise as fast as the prior two during the past decade-plus, and it remains mired well below its 2021 highs. Its recent pattern is more about trading inside a fairly wide range, though it is currently flirting with the low end of that range:
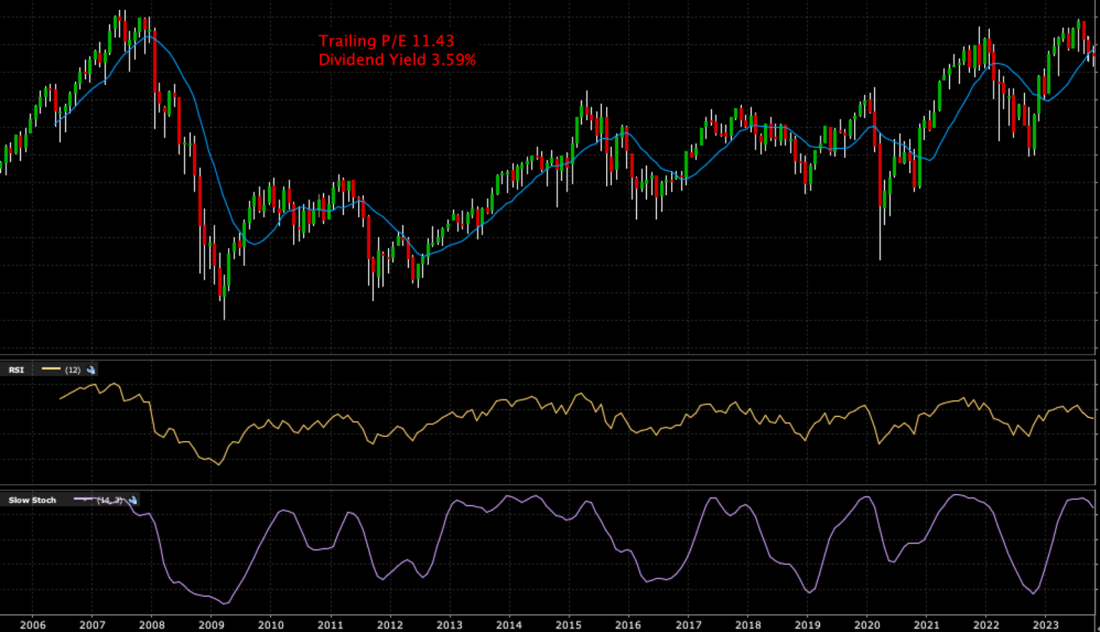
The next chart shows a very different valuation regime entirely. This item as still not recouped its 2008 highs, though it has come close twice. Interestingly, although it has an even more pronounced pattern of recent lower highs and lower lows, its 2003 peak (so far) exceeded its 2001 high. Note also the much lower P/E and higher yield:
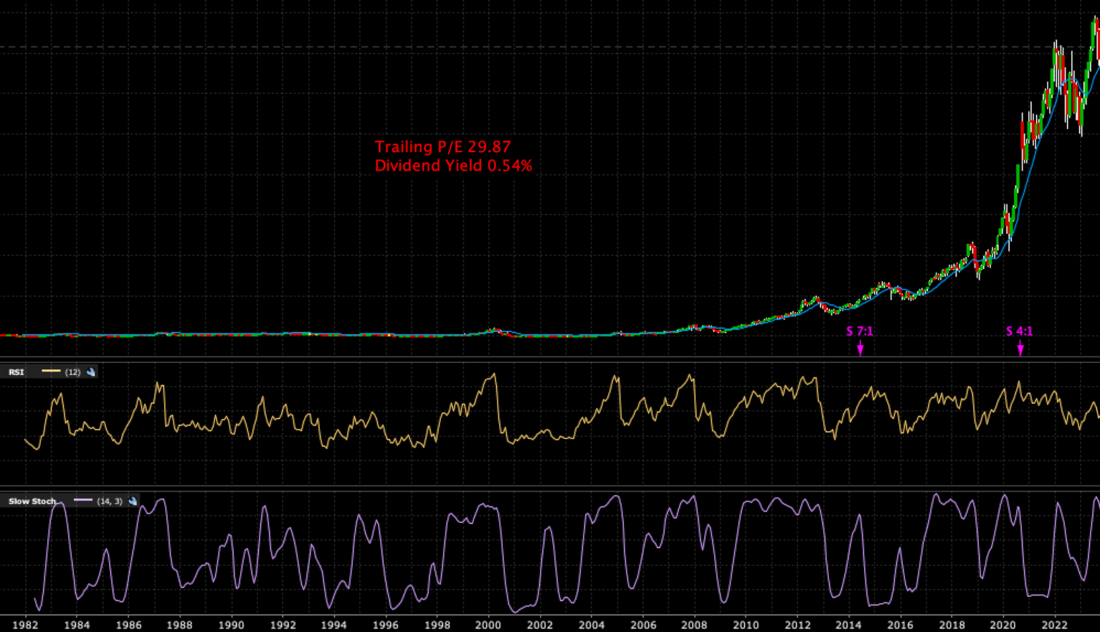
The next graph shows an astoundingly good investment over the prior decade, though it has experienced some wild swings over the past two years. It is nowhere close to its record highs, even after a major bounce this year, and while it has stalled recently, the stochastics are pointing firmly higher. It is by no means a value stock, however:
The next graph tells a very similar story to the prior one:
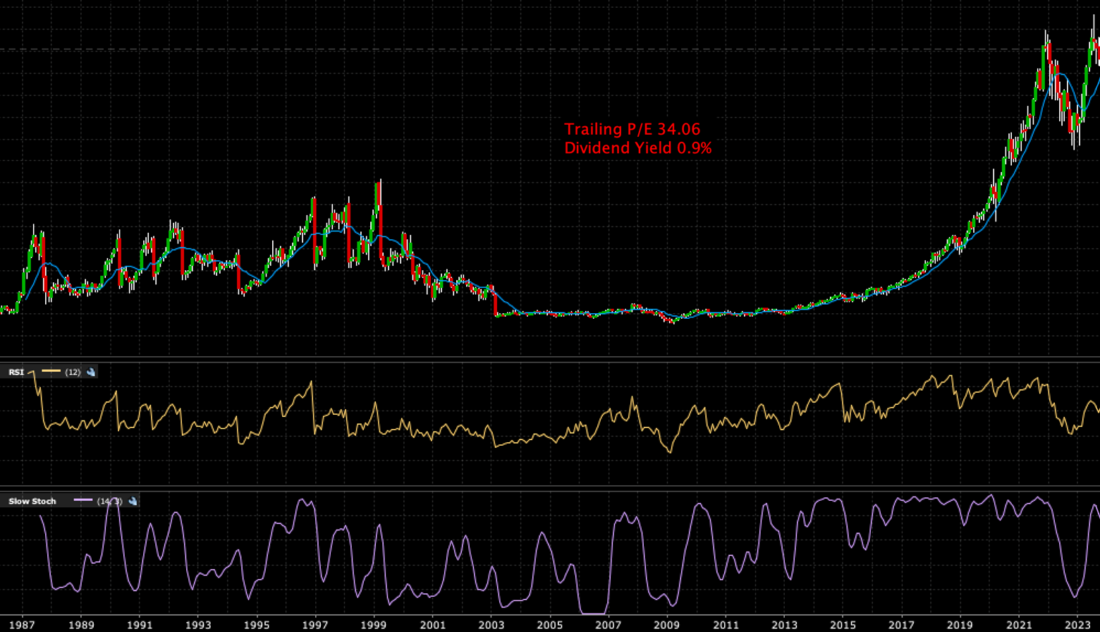
We could go on endlessly with charts like this, but we have a deadline to meet. So rather than ending with more items that have failed to achieve new highs this year, we offer two that have gone parabolic in recent years. Both have long histories and premium valuations, though the latter item seemed for years as though its best days were behind it. Both have ticked lower after recent all-time highs – even though neither had recent highs in RSI – but both also remain above their 12-month moving averages and neither is cheap by conventional valuation metrics:
Here is the “answer key”:
- VIX, as noted
- S&P 500 Index (SPX)
- NASDAQ 100 Index (NDX)
- Russell 2000 ETF (IWM), used as a proxy for the underlying index
- Euro Stoxx50 (ESTX50)
- Amazon (AMZN)
- Tesla (TSLA)
- Apple (AAPL)
- Microsoft (MSFT)
Knowing the items portrayed will allow us to offer are a few takeaways from these long-term views:
- One must appreciate, um, the appreciation in various equity prices over the past few years. Some of them could fall significantly yet still show considerable profits on a long-term basis. It could mean that we are extrapolating recent performance and metrics too aggressively.
- Not surprisingly, it is clear that investors are willing to pay premium prices for top growth names.
- European investors seem to view valuation through a completely different lens, as evidenced by their key index’ much lower P/E and much higher dividend yield.
- If the recent profit-taking in key stocks and indices metastasizes into something more meaningfull, the pullbacks could be quite substantial
—
[i] Thanks to my Dad for pointing some of these out!
Join The Conversation
If you have a general question, it may already be covered in our FAQs. If you have an account-specific question or concern, please reach out to Client Services.
Leave a Reply
Disclosure: Interactive Brokers
The analysis in this material is provided for information only and is not and should not be construed as an offer to sell or the solicitation of an offer to buy any security. To the extent that this material discusses general market activity, industry or sector trends or other broad-based economic or political conditions, it should not be construed as research or investment advice. To the extent that it includes references to specific securities, commodities, currencies, or other instruments, those references do not constitute a recommendation by IBKR to buy, sell or hold such investments. This material does not and is not intended to take into account the particular financial conditions, investment objectives or requirements of individual customers. Before acting on this material, you should consider whether it is suitable for your particular circumstances and, as necessary, seek professional advice.
The views and opinions expressed herein are those of the author and do not necessarily reflect the views of Interactive Brokers, its affiliates, or its employees.


Excellent
We are happy to hear that you are enjoying our articles!
Good article!
We appreciate your engagement!