


Every month, we discuss the “highly anticipated” jobs report and ponder what it might mean for markets. There were “whisper numbers” that anticipated Nonfarm Payrolls to come in even lighter than the published consensus, and there was plenty of talk about the rising unemployment rate triggering the “Sahm Rule.”[i] Umm, no.
- November Nonfarm Payrolls were expected to increase to 185,000 from 150k in October. They came in at 199k. (ADP, which missed estimates and fell on Wednesday, once again failed to be a useful indicator)
- The November Unemployment Rate was expected to be unchanged at 3.9%. It fell to 3.7%, even as the labor force participation rate grew by 0.1% to 62.8%.
- Average Hourly Earnings were expected to rise from 0.2% to 0.3%. They rose to 0.4%
This doesn’t seem consistent with the fixed income market’s recent moves toward pricing in more imminent rate cuts. Bearing in mind the Federal Reserve’s dual mandate for stable prices and maximum sustainable employment:
- An unemployment rate of 3.7% seems pretty close to maximum employment.
- If monthly wages are rising at 0.4% per month, that doesn’t fit either the “stable prices” or “sustainable” metric of 2% inflation.
Was there anything in today’s employment report that would induce the Fed to ease monetary policy in the near future? Not to my eye.
We have been noting that since the aftermath of the last FOMC meeting, Fed Funds futures had been ratcheting forward their expectations for the likely start of rate cuts from June to March, and were anticipating five rate cuts in 2024 instead of three. One might have expected some of those views to have changed – especially with a 13-basis point rise in 2-year Treasury yields. They have, to some degree:
From yesterday:

And updated with current data:

Put in a different format, here is the change in Fed Funds Futures expectations for rates from yesterday to today:

We see that the expectations for a cut in March have fallen from 72.8% to essentially a coin flip. We also see that the likely date for a fifth cut has been pushed out to January 2025. These changes clearly do not price out all the additional rate cut enthusiasm that had been priced in during November and early this month, but the direction has changed today.
The University of Michigan data that arrived an hour and a half later pushed back on the bond market’s apparent hard landing viewpoint. Put simply, it was stunning.
- The Sentiment reading jumped from 61.3 to 69.4, well above the 62.0 consensus estimate.
- Expectations leaped to 66.4, far above last month’s 56.8 and the 57.0 consensus.
- Current conditions rose to 74.0, also above last month’s 68.3 and the 68.5 estimate.
- 1-Year Inflation Expectations plunged to 3.1%. They were at 4.5% last month and estimated to dip to 4.3%.
The last number is particularly interesting. Inflation expectations typically follow gasoline prices, yet they had been rising in recent months even as prices at the pump fell. It’s as though they caught up all at once this morning:
University of Michigan 1-Year Inflation Expectations (yellow), vs. AAA Daily National Average Unleaded Gasoline Prices (green) and Rolling Front-Month Crude Oil Futures (red)
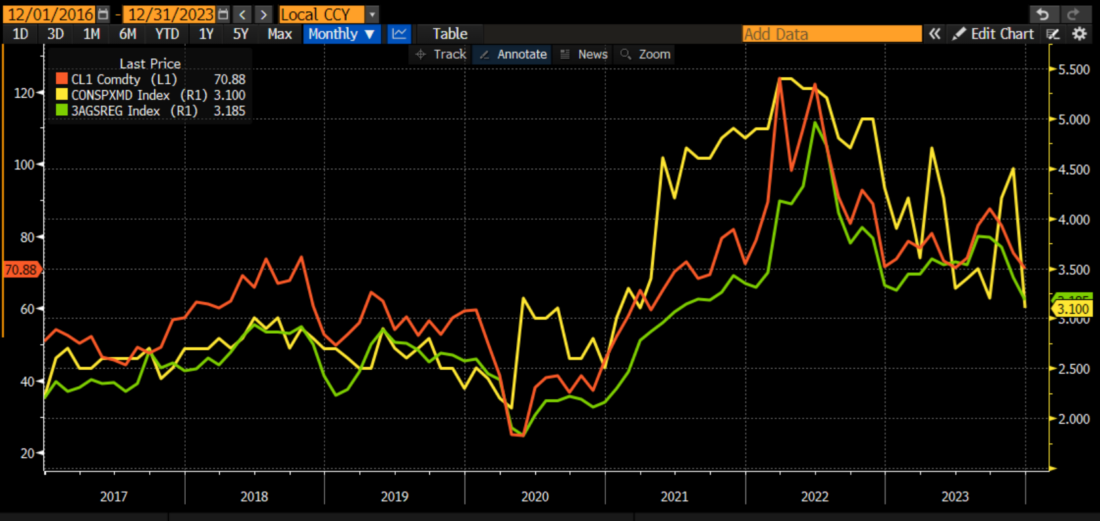
Source: Bloomberg
This may not be as much of a slam dunk for the FOMC as it may appear. While the Fed is assiduously trying to manage inflationary expectations, if the fall in expectations is due largely to falling energy prices, that may not factor heavily into their thinking. Remember, the Fed looks more carefully at core inflation rates, which exclude food and energy. Oh, and those do include wages…
—
[i] According to the St. Louis Fed: [The] Sahm Recession Indicator signals the start of a recession when the three-month moving average of the national unemployment rate (U3) rises by 0.50 percentage points or more relative to the minimum of the three-month averages from the previous 12 months.
Join The Conversation
If you have a general question, it may already be covered in our FAQs. If you have an account-specific question or concern, please reach out to Client Services.
Leave a Reply
Disclosure: Interactive Brokers
The analysis in this material is provided for information only and is not and should not be construed as an offer to sell or the solicitation of an offer to buy any security. To the extent that this material discusses general market activity, industry or sector trends or other broad-based economic or political conditions, it should not be construed as research or investment advice. To the extent that it includes references to specific securities, commodities, currencies, or other instruments, those references do not constitute a recommendation by IBKR to buy, sell or hold such investments. This material does not and is not intended to take into account the particular financial conditions, investment objectives or requirements of individual customers. Before acting on this material, you should consider whether it is suitable for your particular circumstances and, as necessary, seek professional advice.
The views and opinions expressed herein are those of the author and do not necessarily reflect the views of Interactive Brokers, its affiliates, or its employees.


Nice analysis, insight, and summary.
I’ve just added you to my “goto” short list.
Thanks for engaging!
Interested in a more granular time frame on the chart, say, 6 or 12 month Daily. Nonetheless, very insightful analysis, thank you !
Hi Craig, thank you for reaching out. At this time, you cannot select a custom time frame using TradingView Advanced Charts. However, you can create a custom time frame using TWS charts. We hope this helps!
The JOLT’s Report, although a month behind, revised to 9.350M down to 8.733M is down 617K. Less job openings to me means most likely jobs filled. Am I wrong? Friday’s Employment Report at 199K is quite a difference. Also, the UAW strikers were not allowed unemployment. What other variables am I missing?
Please tell me why federal tax receipts are nowhere near where they should be given these constantly revised, fluffed-up reports. We are in a recession – YOY receipts have declined for ~12 months straight and employment keeps going up. Impossible.