

")


Temperatures vary greatly depending on a number of factors, from region to elevation, from time of year to even time of day.
Imagine if someone asked you how hot it was in America last month. How would you respond to such a vague question? As everyone knows, temperatures vary greatly depending on a number of factors, from region to elevation, from time of year to even time of day.
Is the person inquiring about the temperature in Flagstaff, Arizona, in the early morning of Wednesday, May 3—or in Fargo, North Dakota, in the late evening of Sunday, May 28? Are they looking for an answer in Fahrenheit or Celsius?
Most people would agree that the “temperature in America last month” question is absurd, but this is more or less what we get with regard to inflation. Once a month, the Bureau of Labor Statistics (BLS) releases its headline consumer price index (CPI), which is supposed to give us some idea of how much or how little consumer prices changed compared to last month and last year.
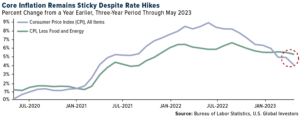
Last week’s CPI, for example, shows that prices in May continued to increase year-over-year, but at a much slower pace of 4%, down from nearly 9% in June of last year.
This makes it seem as if the Federal Reserve’s efforts to bring down inflation by hiking rates are working, but if we strip out volatile food and energy prices, the picture isn’t as rosy. The so-called core CPI—which measures everything except food and energy—shows that prices on average barely budged from May 2022 to May 2023.

I should add that the BLS has continued to revise its methodology over the years. If we still used the 1980s methodology, annual inflation would be closer to 12% than 4%.
Online Prices Saw Largest Monthly Decline Since Start Of Pandemic
Again, just like temperatures, prices can vary significantly state-to-state and even city-to-city. According to the American Automobile Association (AAA), the current average price for a gallon of gasoline is $3.00 in Mississippi, making it the cheapest in the country. In California, by contrast, a trip to the pump will cost you $4.87 per gallon on average, or nearly $2 more.
Similarly, prices can be higher or lower depending on whether you purchase something from a brick-and-mortar store or an online retailer. For years, the joke was that big-box retailers like Best Buy had become a showroom for Amazon. Have your eye on an expensive surround sound system? Best to experience it in person before buying it for cheaper online.
That said, the CPI only measures “offline” prices. BLS workers literally visit or call physical stores to get the price of select items.
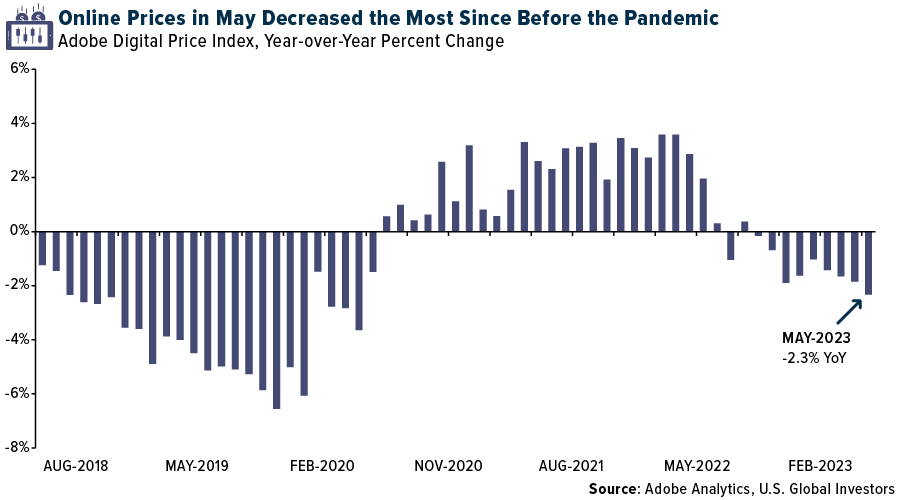
For changes in online prices, we can turn to Adobe—the maker of the portable document format, or pdf, and Photoshop. Contrary to what you might think, Adobe is uniquely qualified to report on inflation trends, as its marketing and web analytics arm tracks an alleged 1 trillion visits to online retailers and over 100 million products across 18 different categories, from electronics to jewelry.
According to the company, online prices fell 2.3% in May compared to the same month last year. To clarify, prices didn’t just slow down, they got cheaper, and at the fastest pace since the start of the pandemic. Among the product categories that decreased the most were computers (-16.45%), electronics (-12.04%), appliances (-7.86%) and sporting goods (-7.39%). Categories that increased in price over the 12 months were personal care products, tools and home improvement, medical equipment, nonprescription drugs, clothes, groceries and pet products.
Will Fed Action Trigger Another Crisis?
My point in sharing this with you is to make it clear that measuring changes in consumer prices is a messy, imprecise undertaking, one that can result in conflicting data, as the difference between offline and online prices shows.
And yet these data are used by both the public and private sectors to guide important policy decisions, including cost-of-living adjustments, Social Security payments and more.
In perhaps the most well-known example, the Fed uses BLS data to inform monetary policy. Last week, the central bank elected to leave rates the same but indicated it may need to raise them at least two more times this year, despite the fact that this tightening cycle is already the most aggressive since at least the 1987-1989 cycle.
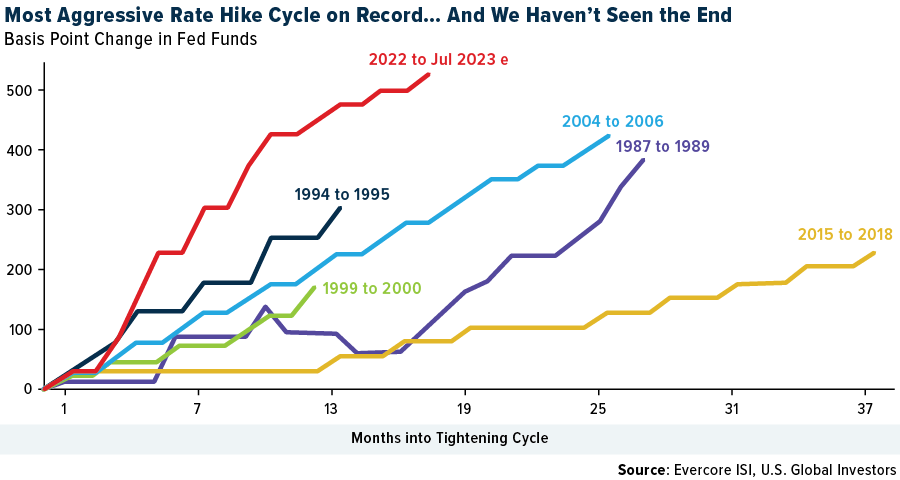
As Evercore ISI’s Ed Hyman put it last week, if we take the Fed’s balance sheet normalization into consideration, today’s effective rate is really around 6%. The regional banking crisis may be behind us, Hyman says, but the risk of “another financial shock/crisis in another area” rises as rates remain on an upward trajectory.
Preparing Your Portfolio For A High-Inflation, High-Interest Rate Environment
It may be impossible to say that any asset class or investment is immune to the kind of volatile swings in inflation and interest rates we’re seeing today, but luxury stocks are a strong contender, I believe. Because luxury brands tend to have decades of name recognition behind them, and because they limit supply, they’ve historically had incredible pricing power, able to raise prices without severely impacting demand from mostly affluent consumers.
Many luxury items have themselves been smart investments, with Hermès’ famous Birkin bag often outperforming the S&P 500 and gold. Between 2011 and 2021, the price of pre-owned Rolex watches beat advances in the stock market, gold and real estate.
The S&P Global Luxury Index, up a little over 20% year-to-date, is still below its all-time high set in November 2021, making now an attractive buying opportunity, according to Bank of America (BofA). Companies in the luxury industry are “likely” to continue beating earnings expectations as profits remain strong on buoyant sales, BofA analyst Ashley Wallace said in a note this week.
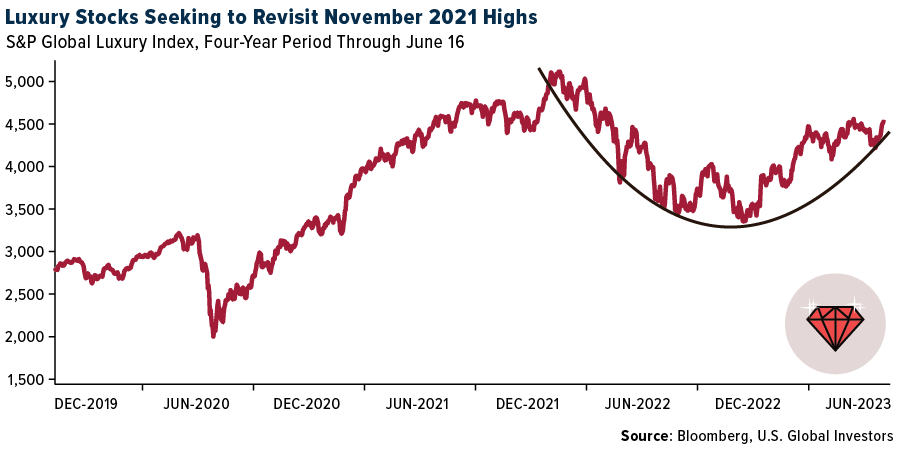
“Historically, pullbacks in the sector have been buying opportunities and this time will likely be no different,” Wallace wrote, adding that demand in China has continued to exceed expectations despite an underwhelming economic reopening.
BofA’s top luxury picks include LVMH, Europe’s largest company after surpassing $500 billion in market cap this year; Cartier-owner Richemont; and Hermès.
—
Originally Posted Jun3 20, 2023 – Why Inflation Isn’t One-Size-Fits-All
Holdings may change daily. Holdings are reported as of the most recent quarter-end. The following securities mentioned in the article were held by one or more accounts managed by U.S. Global Investors as of (03/31/2023): LVMH Moet Hennessy Louis Vuitton SA, Cie Financiere Richemont SA, Hermes International.
The Consumer Price Index (CPI) is one of the most widely recognized price measures for tracking the price of a market basket of goods and services purchased by individuals. The weights of components are based on consumer spending patterns. The S&P 500 Stock Index is a widely recognized capitalization-weighted index of 500 common stock prices in U.S. companies. The S&P Global Luxury Index is comprised of 80 of the largest publicly traded companies engaged in the production or distribution of luxury goods or the provision of luxury services that meet specific investibility requirements. Adobe’s Digital Price Index is modeled after the Consumer Price Index (CPI), published by the U.S. Bureau of Labor Statistics, and uses the Fisher Price Index to track online prices.
All opinions expressed and data provided are subject to change without notice. Some of these opinions may not be appropriate to every investor.
Disclosure: US Global Investors
All opinions expressed and data provided are subject to change without notice. Holdings may change daily.
Some of these opinions may not be appropriate to every investor. By clicking the link(s) above, you will be directed to a third-party website(s). U.S. Global Investors does not endorse all information supplied by this/these website(s) and is not responsible for its/their content.
About U.S. Global Investors, Inc. – U.S. Global Investors, Inc. is an investment adviser registered with the Securities and Exchange Commission (“SEC”). This does not mean that we are sponsored, recommended, or approved by the SEC, or that our abilities or qualifications in any respect have been passed upon by the SEC or any officer of the SEC.
This commentary should not be considered a solicitation or offering of any investment product.
Certain materials in this commentary may contain dated information. The information provided was current at the time of publication.
Some links above may be directed to third-party websites. U.S. Global Investors does not endorse all information supplied by these websites and is not responsible for their content.
Please consider carefully a fund’s investment objectives, risks, charges and expenses. For this and other important information, obtain a fund prospectus by clicking here or by calling 1-800-US-FUNDS (1-800-873-8637). Read it carefully before investing. Foreside Fund Services, LLC, Distributor. U.S. Global Investors is the investment adviser.
Disclosure: Interactive Brokers
Information posted on IBKR Campus that is provided by third-parties does NOT constitute a recommendation that you should contract for the services of that third party. Third-party participants who contribute to IBKR Campus are independent of Interactive Brokers and Interactive Brokers does not make any representations or warranties concerning the services offered, their past or future performance, or the accuracy of the information provided by the third party. Past performance is no guarantee of future results.
This material is from US Global Investors and is being posted with its permission. The views expressed in this material are solely those of the author and/or US Global Investors and Interactive Brokers is not endorsing or recommending any investment or trading discussed in the material. This material is not and should not be construed as an offer to buy or sell any security. It should not be construed as research or investment advice or a recommendation to buy, sell or hold any security or commodity. This material does not and is not intended to take into account the particular financial conditions, investment objectives or requirements of individual customers. Before acting on this material, you should consider whether it is suitable for your particular circumstances and, as necessary, seek professional advice.


Join The Conversation
If you have a general question, it may already be covered in our FAQs. If you have an account-specific question or concern, please reach out to Client Services.