


Dell Earnings Straddle Strategy and Trading Benchmarks
Dell is gearing up to release its earnings report on November 30, after the market’s closing bell. As many traders, you may be paying attention to the option straddle as a potential opportunity. And of course, as a trader you would want to reference relevant benchmarks to help assess the current market prices.
As you watch Dell’s pre-earnings option straddle prices fluctuate, you maybe asking how far away is the market from a theoretical fair value?
To help with that question, we turn to historical benchmarks, which provide valuable insights into the typical straddle values observed before earnings releases. By analyzing these benchmarks, we can assess whether the current market price is aligned with historical expectations or deviating significantly, potentially indicating an opportunity.
What Is The Typical Price Of An Earnings Straddle For Dell?
Let’s examine historical straddle prices right before Dell’s earnings announcements.
Historical Pre-Earnings Option Straddle Values For Dell

Source: Market Chameleon
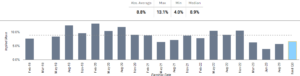
The chart above provides a visual representation of historical straddle premiums for Dell. Each bar on the chart represents the straddle premium at the close right before earnings. These visuals offer valuable insights into the variations in straddle premiums over time.
Let’s Review The Key Benchmarks For Dell’s Earnings Straddle
What Is The Average Pre-Earnings Straddle Value For Dell?
Our first benchmark is the average closing value. On average, the straddle closed at a 8.8% premium over the underlying stock price. This figure serves as a reference point for comparing current market prices.
What Is The Range?
We also provide the range, spanning from a high of 13.1% to a low of 4%. This range offers essential context, helping you gauge where today’s market prices stand in relation to historical extremes.
What Is The Median Value?
The median value, pegged at 8.9%, indicates a well-balanced distribution of data. There’s no notable skew in one direction.
What Is The Current Straddle Market Value?
For a swift visual perspective, the light blue bar on the chart illustrates where the current straddle is trading concerning historical benchmarks. You can visualize how the current market, which stands at 6.8%, compares to the previous closing values for a relative perspective.
In Conclusion
These historical benchmarks provide a valuable perspective that is not readily available from other sources, empowering traders to make informed decisions tailored to Dell’s earnings straddle. While we don’t know the future, benchmarks can certainly help you gauge the present, offering insights that can be instrumental in your trading strategies.
As always, remember that past performance is not indicative of future results, and all trading involves risks.
—
Originally Posted November 25, 2023 – Are You Thinking About Trading Dell’s Earnings Straddle? You May Want To Look At These Key Benchmarks
Disclaimer: The information provided in this article is intended for educational and informational purposes only. It does not constitute financial advice, trading recommendations, or a guarantee of future performance.
Disclosure: Market Chameleon
The information provided on MarketChameleon is for educational and informational purposes only. It should not be considered as financial or investment advice. Trading and investing in financial markets involve risks, and individuals should carefully consider their own financial situation and consult with a professional advisor before making any investment decisions. MarketChameleon does not guarantee the accuracy, completeness, or reliability of the information provided, and users acknowledge that any reliance on such information is at their own risk. MarketChameleon is not responsible for any losses or damages resulting from the use of the platform or the information provided therein. The 7-day free trial is offered for evaluation purposes only, and users are under no obligation to continue using the service after the trial period.
Disclosure: Interactive Brokers
Information posted on IBKR Campus that is provided by third-parties does NOT constitute a recommendation that you should contract for the services of that third party. Third-party participants who contribute to IBKR Campus are independent of Interactive Brokers and Interactive Brokers does not make any representations or warranties concerning the services offered, their past or future performance, or the accuracy of the information provided by the third party. Past performance is no guarantee of future results.
This material is from Market Chameleon and is being posted with its permission. The views expressed in this material are solely those of the author and/or Market Chameleon and Interactive Brokers is not endorsing or recommending any investment or trading discussed in the material. This material is not and should not be construed as an offer to buy or sell any security. It should not be construed as research or investment advice or a recommendation to buy, sell or hold any security or commodity. This material does not and is not intended to take into account the particular financial conditions, investment objectives or requirements of individual customers. Before acting on this material, you should consider whether it is suitable for your particular circumstances and, as necessary, seek professional advice.
Disclosure: Options (with multiple legs)
Options involve risk and are not suitable for all investors. For information on the uses and risks of options, you can obtain a copy of the Options Clearing Corporation risk disclosure document titled Characteristics and Risks of Standardized Options by clicking the link below. Multiple leg strategies, including spreads, will incur multiple transaction costs. "Characteristics and Risks of Standardized Options"


Join The Conversation
If you have a general question, it may already be covered in our FAQs. If you have an account-specific question or concern, please reach out to Client Services.