


")


NVDA’s Stock Momentum and Strategies for Harnessing Its Volatility
NVDA (NVIDIA Corporation) stock has soared to new heights this year, primarily bolstered by its advancements in AI technology. With a staggering gain of 238% over the past year, it’s one of the top-performing stocks in the S&P 500. As a result, investors, big and small, are extremely enthusiastic about the company’s products, jumping into the stock with fervor.
This fervor has its consequences. NVDA stock can be quite volatile, with investors constantly speculating on the implications of AI on its future revenue streams. For those looking to capitalize on this volatility, an option straddle might be an attractive strategy. In this article, we examine the NVDA 1-month straddle to determine if it offers good value relative to its price.
NVDA 1-Month Straddle Analysis
NVDA 1 Month Option Straddle Benchmark
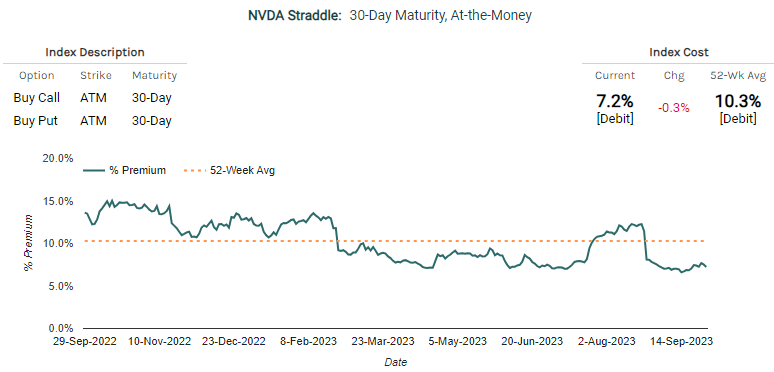
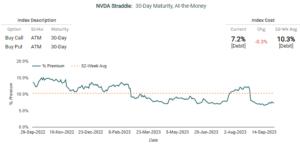
Relying on the benchmark provided by Market Chameleon for a 1-month at-the-money straddle, the current straddle is priced at a 7.2% premium. This means that for the straddle to be profitable, NVDA’s stock would need to swing at least 7.2% in any direction to offset the combined premium of both the call and put options. Profits kick in for movements beyond this range.
Interestingly, there has been a downward trend in the straddle’s price. It’s now substantially lower than its 52-week average of 10.3%. Thus, from a historical standpoint, the current premium seems relatively affordable.
Historical Movements of NVDA
Considering the 7.2% movement required for the straddle to break even at expiration, it’s beneficial to assess how frequently NVDA stock has surpassed this threshold in the past. By using Market Chameleon’s historical return distribution tool and analyzing 4 years of data, some intriguing insights emerge:
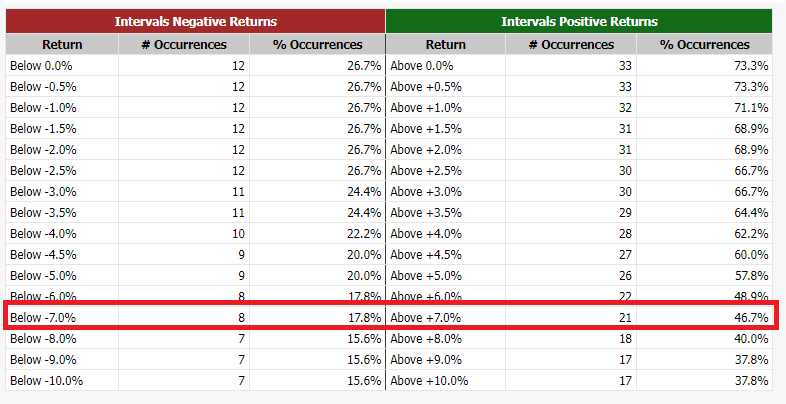
– NVDA’s stock surged by more than 7% in 46.7% of the instances.
– The stock plummeted by over 7% in 17.8% of the cases.
Cumulatively, NVDA exhibited more than a 7% movement in either direction 64.5% of the time.
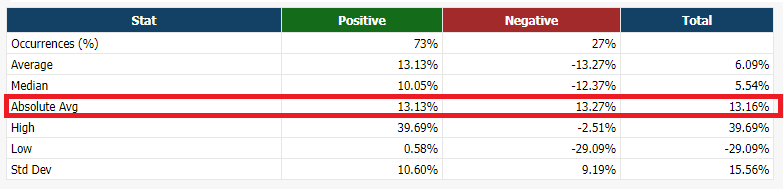
The average movement over these instances was +/- 13.16%, as you can see below. Given this historical context, the current NVDA straddle seems potentially undervalued.
In Conclusion
Knowing NVDA’s price trajectory in the upcoming month is, of course, impossible. However, for investors intrigued by NVDA’s volatility and wanting to exploit it, the 1-month straddle appears to be a compelling option. Not only is the straddle’s premium considerably lower than its historical average, but if past stock movements serve as any indicator, achieving the necessary price swing to cover the straddle’s premium seems entirely plausible.
—
Originally Posted September 28, 2023 – Is The NVDA 1 Month Option Straddle A Good Deal?
Disclaimer: The information provided in this article is for informational purposes only and should not be construed as investment advice, endorsement, or an offer or solicitation to buy or sell securities. The views expressed in this article represent the author’s opinions and should not be considered as financial advice. Investing involves risks, including the potential loss of capital. Before making any investment decisions, readers should conduct their own research and seek advice from a qualified financial advisor.
Disclosure: Market Chameleon
The information provided on MarketChameleon is for educational and informational purposes only. It should not be considered as financial or investment advice. Trading and investing in financial markets involve risks, and individuals should carefully consider their own financial situation and consult with a professional advisor before making any investment decisions. MarketChameleon does not guarantee the accuracy, completeness, or reliability of the information provided, and users acknowledge that any reliance on such information is at their own risk. MarketChameleon is not responsible for any losses or damages resulting from the use of the platform or the information provided therein. The 7-day free trial is offered for evaluation purposes only, and users are under no obligation to continue using the service after the trial period.
Disclosure: Interactive Brokers
Information posted on IBKR Campus that is provided by third-parties does NOT constitute a recommendation that you should contract for the services of that third party. Third-party participants who contribute to IBKR Campus are independent of Interactive Brokers and Interactive Brokers does not make any representations or warranties concerning the services offered, their past or future performance, or the accuracy of the information provided by the third party. Past performance is no guarantee of future results.
This material is from Market Chameleon and is being posted with its permission. The views expressed in this material are solely those of the author and/or Market Chameleon and Interactive Brokers is not endorsing or recommending any investment or trading discussed in the material. This material is not and should not be construed as an offer to buy or sell any security. It should not be construed as research or investment advice or a recommendation to buy, sell or hold any security or commodity. This material does not and is not intended to take into account the particular financial conditions, investment objectives or requirements of individual customers. Before acting on this material, you should consider whether it is suitable for your particular circumstances and, as necessary, seek professional advice.
Disclosure: Options Trading
Options involve risk and are not suitable for all investors. Multiple leg strategies, including spreads, will incur multiple commission charges. For more information read the "Characteristics and Risks of Standardized Options" also known as the options disclosure document (ODD) or visit ibkr.com/occ
")


Join The Conversation
If you have a general question, it may already be covered in our FAQs. If you have an account-specific question or concern, please reach out to Client Services.