

")


Holiday shortened weeks can be rather dull. People are usually more focused upon their days off or getaways to devote their full attention to the markets. Not today, however. We will receive what is arguably the most important earnings result of all when Nvidia (NVDA) reports third-quarter earnings after the close.
NVDA has the 5th highest weighting in both the S&P 500 (SPX) and NASDAQ 100 (NDX) indexes[i], but an outsized role in these indices’ recent performance. The stock has more than doubled this year and yesterday closed at an all-time high. One can argue that NVDA is the true poster child for the enthusiasm surrounding artificial intelligence (AI), more even than Microsoft (MSFT), Alphabet (GOOG, GOOGL) and a host of others.[ii]
Put simply, NVDA has been the most magnificent of the “Magnificent Seven.”
On the day after NVDA released blowout Q1 earnings in May, we entitled our piece “It’s Nvidia’s World, We’re Just Living (and Investing) in It”, and I believe that holds true today. Put simply, if you didn’t own NVDA, you were unlikely to match, let alone beat, the performance of key indexes. One has to consider how much of the stock’s recent performance – up about 25% so far in November! – was the result of institutional portfolio managers playing a desperate game of catch-up once overall market sentiment turned.
NVDA, 1-Year Daily Candles
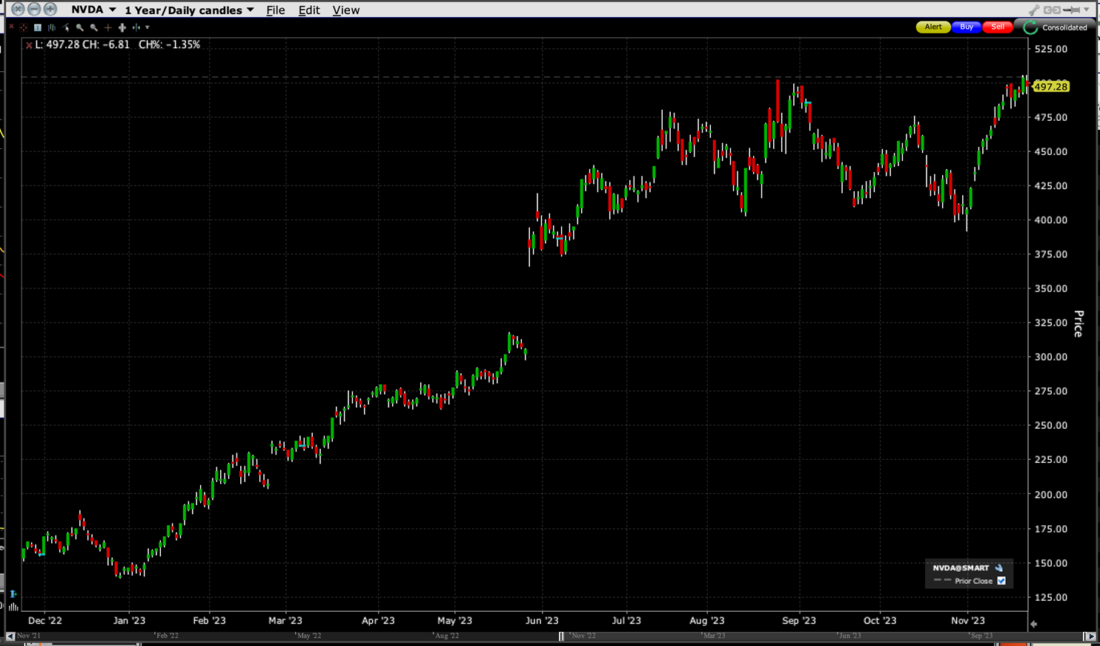
Source: Interactive Brokers
We have pointed out — ok, complained about — investors paying premium prices for growth stocks whether or not they are actually growing. That certainly does not apply to NVDA. The company’s recent growth has been phenomenal. If today’s results come in as anticipated, its consensus revenue expectation of $16.1 billion would represent a 171% increase over one year ago, and it’s EPS consensus estimate of $3.37 would be over 1,100% higher than four quarters ago. (That is not a typo. NVDA earned $0.28 per share in 3Q 2023).
But herein lies the risk. While stock sports a trailing P/E of 115 – understandable when we consider how rapidly earnings have grown – it still sports a forward P/E around 45. That means that a considerable amount of earnings growth has been priced in. The combination of price and earnings performance has raised the bar substantially for NVDA. It is difficult to say how much good news is truly priced into the stock at current levels, but one must consider whether even “as-expected” results will indeed be good enough. Remember, even though the stock zoomed after reporting earnings in February and May (note the gaps on the above chart), it was essentially unchanged after reporting a huge beat in August.
Perhaps we can consider it a good thing that options traders are already pricing in some caution. The IBKR Probability Lab shows a peak in the $482-485 range for options expiring on Friday, about 2.5% below current levels:
IBKR Probability Lab for NVDA Options Expiring November 24, 2023
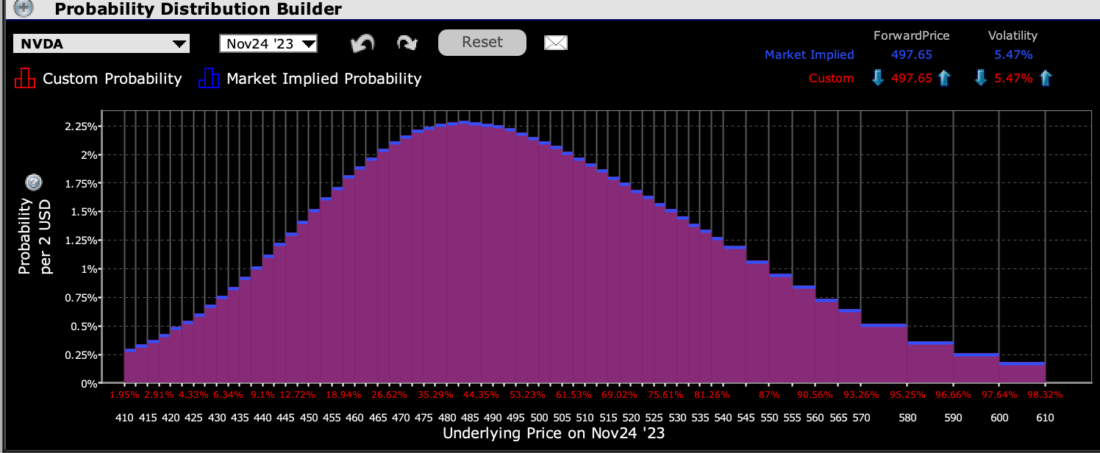
Source: Interactive Brokers
Meanwhile, the Multi-Expiry Skew graph is relatively symmetrical, with a dip in implied volatility around $450. Considering that both the 50-day and 100-day moving averages currently converge around that level, it is not surprising that traders would show some faith that we would see support – if necessary – around them. Meanwhile, we see that traders are hardly loath to bet against an upside surprise, notwithstanding the recent run-up:
NVDA Skew for Options Expiring November 24th (green), December 1st (blue), December 8th (yellow)
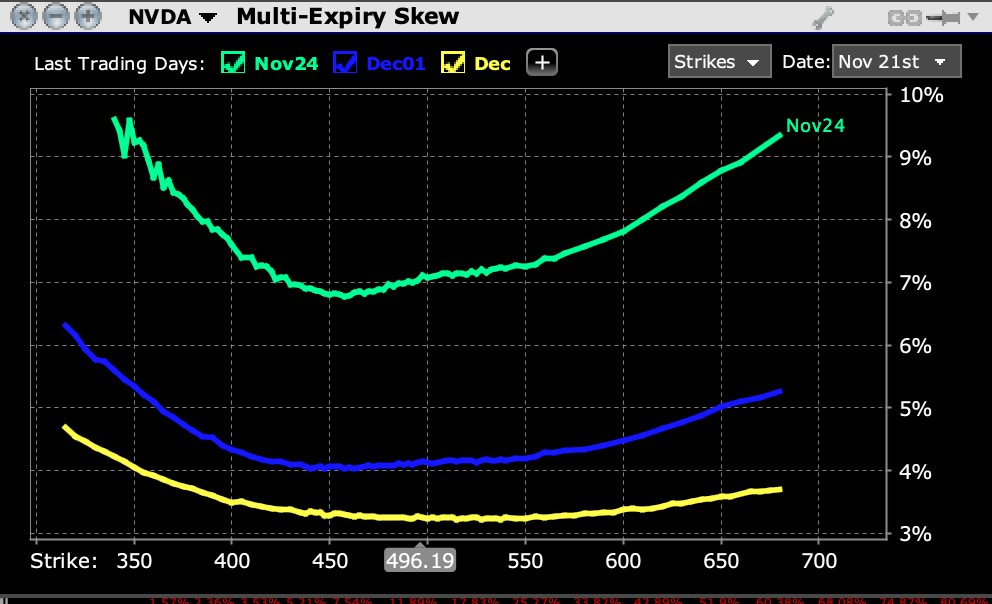
Source: Interactive Brokers
Finally, a glance at the term structure of implied volatilities shows that traders are pricing in a 7% daily volatility for NVDA for the remainder of the week (bear in mind that we only have 1.5 trading days after today). That is almost exactly the long-term post-earnings move for NVDA. That said, we’ve seen widely divergent moves over the past two years, though mostly to the upside (+0.1%, +24.4%, +14.0%, -1.5%, +4.0%, +5.2%, -7.6%, +8.3%). Could it be that at-money options are a bit low in their volatility assessment?
NVDA Term-Structure of Implied Volatility
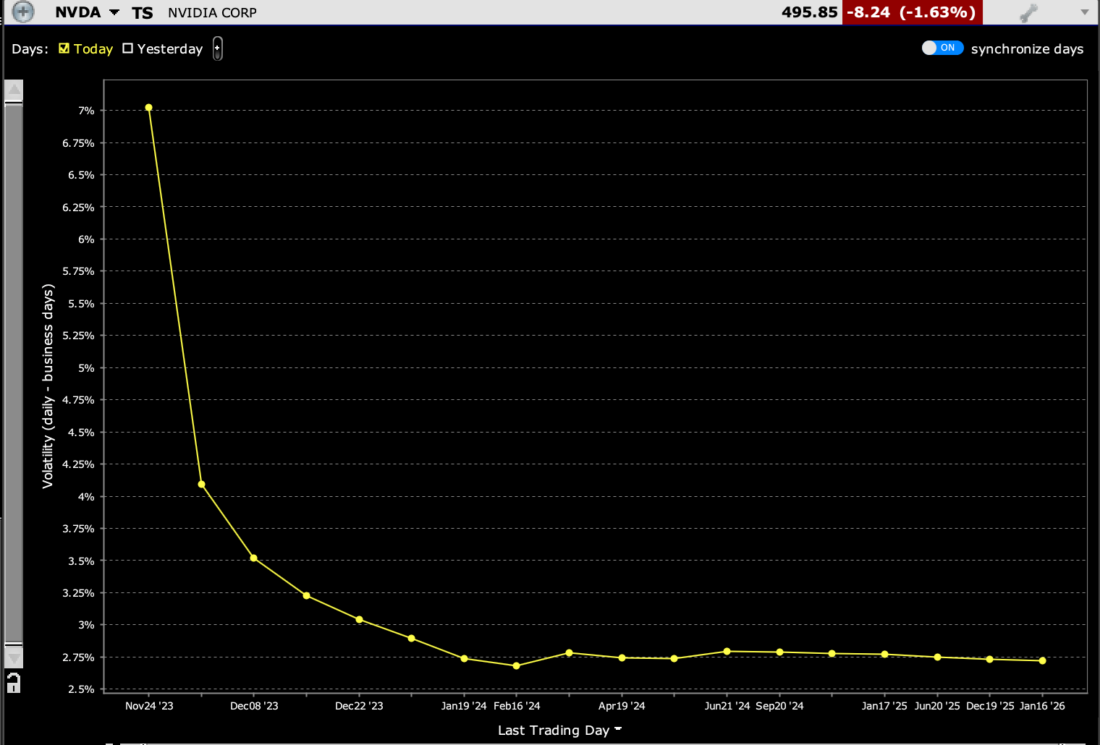
Source: Interactive Brokers
Sometime after today’s close we’ll know whether we need to buckle in for a wild pre-holiday session, or whether we can turn our full attention to Thanksgiving, turkey, and football.
—
[i] Behind Apple (AAPL). Microsoft (MSFT), the combined two classes of Alphabet (GOOG, GOOGL) and Amazon (AMZN)
[ii] Remember, OpenAI is not publicly traded.
Disclosure: Interactive Brokers
The analysis in this material is provided for information only and is not and should not be construed as an offer to sell or the solicitation of an offer to buy any security. To the extent that this material discusses general market activity, industry or sector trends or other broad-based economic or political conditions, it should not be construed as research or investment advice. To the extent that it includes references to specific securities, commodities, currencies, or other instruments, those references do not constitute a recommendation by IBKR to buy, sell or hold such investments. This material does not and is not intended to take into account the particular financial conditions, investment objectives or requirements of individual customers. Before acting on this material, you should consider whether it is suitable for your particular circumstances and, as necessary, seek professional advice.
The views and opinions expressed herein are those of the author and do not necessarily reflect the views of Interactive Brokers, its affiliates, or its employees.
Disclosure: Probability Lab
The projections or other information generated by the Probability Lab tool regarding the likelihood of various investment outcomes are hypothetical in nature, do not reflect actual investment results and are not guarantees of future results. Please note that results may vary with use of the tool over time.
Disclosure: Options Trading
Options involve risk and are not suitable for all investors. Multiple leg strategies, including spreads, will incur multiple commission charges. For more information read the "Characteristics and Risks of Standardized Options" also known as the options disclosure document (ODD) or visit ibkr.com/occ


Join The Conversation
If you have a general question, it may already be covered in our FAQs. If you have an account-specific question or concern, please reach out to Client Services.