


Earnings season is back (babe), thanks mainly to the run of banks and brokers that began on Friday. As this week progresses, we learn the results from a wider range of companies and industries, including about 10% of the companies in the S&P 500 Index (SPX). This afternoon, specifically, we hear from a member of the “Magnificent Seven” and the original “N” in “FAANG”. We’re referring, of course to Tesla (TSLA) and Netflix (NFLX). Unfortunately, time and space constraints allow us only to focus on TSLA today.
Although TSLA has been a stellar performer on a year-to-date basis, having roughly doubled while SPX is up about 13% in that timeframe, its performance since its last earnings report has been disappointing. It’s down about -15% since then, worse than the -5% drop in SPX during that span. Here is a chart of TSLA from July 18th – the day prior to the release of second quarter earnings – through today:
TSLA, 66 Days / 3 Hour Candles
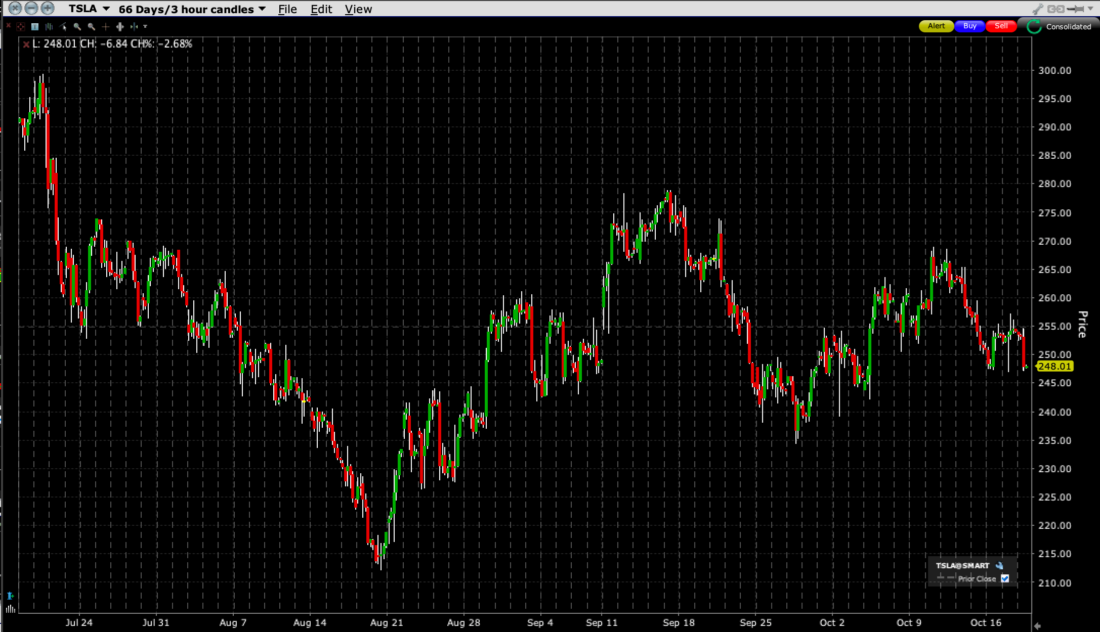
Source: Interactive Brokers
After a series of price cuts and increasing competition, especially in China, the stakes are high for both TSLA and the broader markets today. It is the 7th largest company in SPX and the NASDAQ 100 (NDX), with about a 2% and 3% weighting in each, respectively, but it is a clear #1 in traders’ mindshare. It is routinely the most actively traded stock on the IBKR platform by a wide margin. Thus, no matter what your opinions about TSLA and its leader, whether devotee or despiser, traders need to care about the market’s reaction to the company’s results.
A key question will be whether investors still expect too much from the company. According to a Bloomberg report, third-quarter earnings expectations have been halved over the course of this year even as the stock has doubled. That should strike many as a serious mismatch. The company sports a trailing P/E of 70, and interestingly shows a 12-month forward P/E of 74. That implies both that investors are willing to pay a substantial premium for TSLA’s future growth even as its earnings over the coming four quarters are expected to decline.
To set the stage, here are some of the metrics that the market will focus on this afternoon. According to a Barron’s report, the analyst consensus for EPS is $0.72 on sales of $23.9 billion. But as we learned last quarter, investors focused more on declining gross margins and Elon Musk’s commentary. We of course can’t predict the CEO’s demeanor, but the street is hoping for gross margins between 17% and 18%. We flagged that last quarter as a key concern, writing ahead of earnings:
Gross profit margins are considered to be a key metric. They are projected to be about 18%, down from last quarter’s 19% and last year’s 30%. As with any company, but even more crucially for TSLA, much of the market’s reaction will depend upon the company’s guidance, particularly about whether margins might rise sufficiently to allow profit upgrades.
Then, the next day we noted:
The actual 18.2% margin didn’t seem too terrible, but it became more concerning when Elon Musk seemed peeved with repeated questions about margin expansion during his conference call. He did his best to try to get investors focused on the future with talk about technology licensing and the cybertruck, but quite frankly one could easily assert that TSLA’s 85 P/E is pricing in a considerable amount of good news already.
It is important to note that the stock fell nearly -10% after each of the last two earnings reports in April and July, though it rose by more than 10% in January. It would not be at all surprising if substantial volatility would be once again priced into the market.
Yet it’s not. At-money TSLA options expiring on Friday sport an implied volatility of about 100%, which translates into implied daily moves of about 5%. That seems quite sanguine in light of a sequence of three ~10% moves:
TSLA Volatility Term Structure
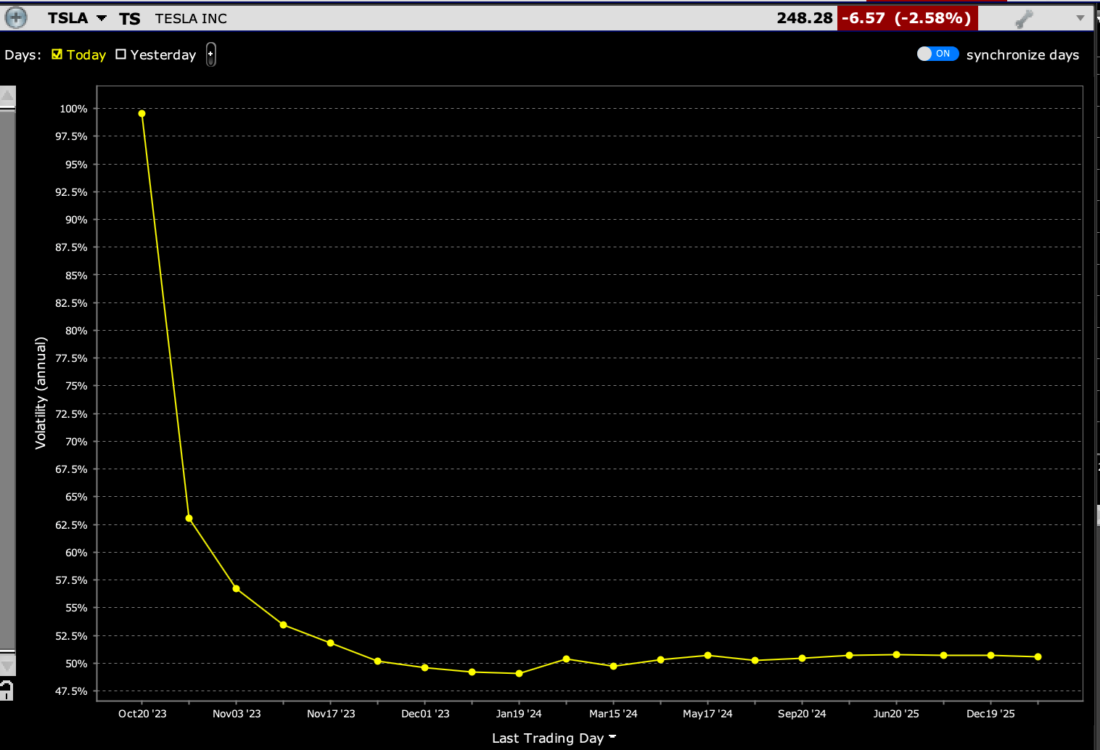
Source: Interactive Brokers
The IBKR Probability Lab shows no particular bias in either direction. The peak probabilities for this week’s options are right around the money, which is typical, but there is no bias up or down in the expected outcomes:
IBKR Probability Lab for TSLA Options Expiring October 20th, 2023
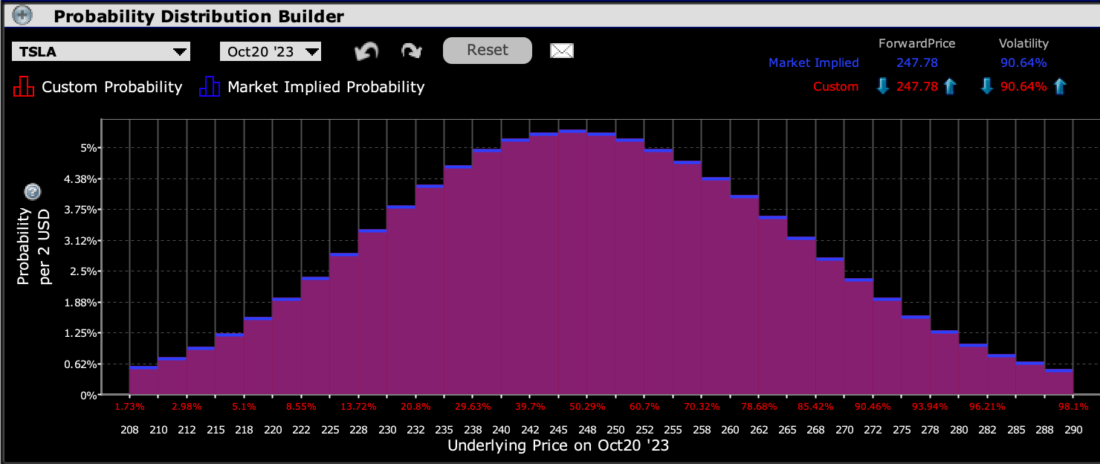
Source: Interactive Brokers
Not surprisingly, in light of what we have just seen, skews for near-term options in TSLA are relatively symmetrical:
TSLA Multi-Expiry Skew for Options Expiring October 20th (yellow), October 27th (blue) and November 17th
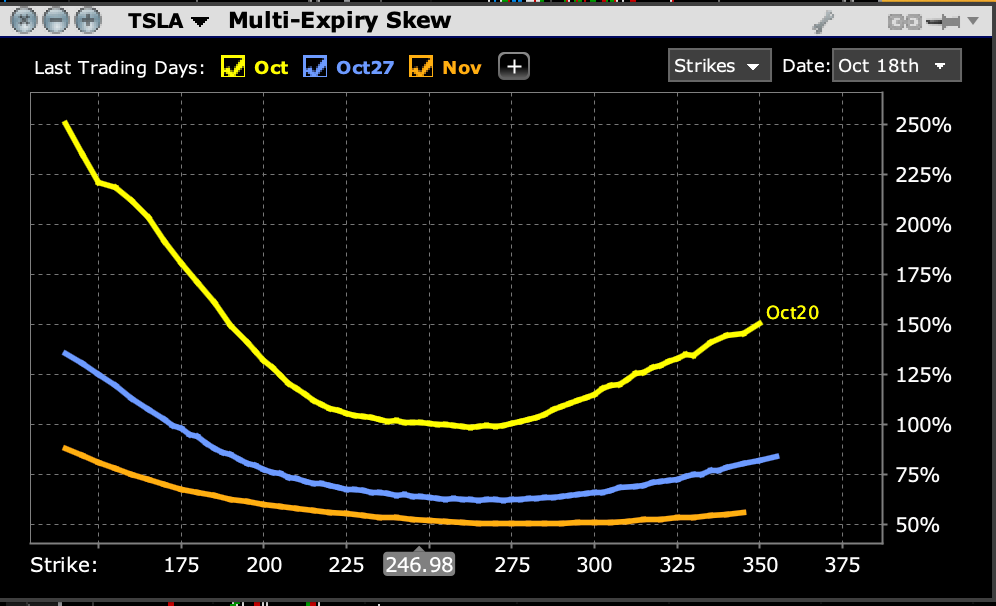
Source: Interactive Brokers
Traders should consider if there is an opportunity present in the relatively low implied volatilities, either by purchasing relatively inexpensive protection or speculation, or using strategies like straddles, strangles, butterflies, or condors if they believe that near-term options offer a value. Whether or not the options market is appropriately pricing post-earnings volatility in TSLA, it seems quite fair to remember that no matter what, it is rarely boring.[I]
—
[i] The Boring Company is a separate Musk-controlled entity
Disclosure: Interactive Brokers
The analysis in this material is provided for information only and is not and should not be construed as an offer to sell or the solicitation of an offer to buy any security. To the extent that this material discusses general market activity, industry or sector trends or other broad-based economic or political conditions, it should not be construed as research or investment advice. To the extent that it includes references to specific securities, commodities, currencies, or other instruments, those references do not constitute a recommendation by IBKR to buy, sell or hold such investments. This material does not and is not intended to take into account the particular financial conditions, investment objectives or requirements of individual customers. Before acting on this material, you should consider whether it is suitable for your particular circumstances and, as necessary, seek professional advice.
The views and opinions expressed herein are those of the author and do not necessarily reflect the views of Interactive Brokers, its affiliates, or its employees.
Disclosure: Probability Lab
The projections or other information generated by the Probability Lab tool regarding the likelihood of various investment outcomes are hypothetical in nature, do not reflect actual investment results and are not guarantees of future results. Please note that results may vary with use of the tool over time.
Disclosure: Options Trading
Options involve risk and are not suitable for all investors. Multiple leg strategies, including spreads, will incur multiple commission charges. For more information read the "Characteristics and Risks of Standardized Options" also known as the options disclosure document (ODD) or visit ibkr.com/occ


Join The Conversation
If you have a general question, it may already be covered in our FAQs. If you have an account-specific question or concern, please reach out to Client Services.