


While second quarter earnings season kicked off last week, many consider the real tests to begin when the so-called “Magnificent Seven” stocks report. The first of those is after the close today when Tesla (TSLA) reports. (Netflix (NFLX), a former FAANG stalwart with a stellar year-to-date performance of its own, also releases earnings today.)
Even though TSLA is “only” the fifth-largest US company by market capitalization, it is the clear number one in many investors’ mindspace. It is perpetually the most actively traded stock and equity option class at our firm. The cumulative volume numbers are astounding. Using Bloomberg data for average price and volume, nearly $30 trillion worth of TSLA shares have changed hands this year, over 30X the company’s market capitalization. (For comparison, about $8.6 trillion of MSFT have traded, which is a bit over 3X it’s market cap).
With the stock up about 140% on a year-to-date basis, with about half of those gains occurring since it’s last (disappointing) earnings report, it is clear that a considerable amount of good news is being priced into TSLA shares. By any metric, the stock is phenomenally expensive. Its P/E is an eye-watering 87 on both a trailing and forward basis, and its PEG ratio is an eye-watering 5.1. Investors are paying a huge growth premium, yet analyst estimates – at least for the next 12 months – are relatively stagnant.
According to FactSet data, reported by Barron’s, street consensus is for operating income of $2.7 billion, earnings per share (EPS) of 80 cents, and revenues of $24.2 billion. The market so far cares little that none of those numbers are projected to be only modestly above last year’s or last quarter’s results. In the second quarter of 2022, Tesla generated operating income of $2.5 billion, and EPS of 76 cents on sales of $16.9 billion. Last quarter, operating income was $2.7 billion, and EPS was 85 cents on sales of $23.3 billion. Gross profit margins are considered to be a key metric. They are projected to be about 18%, down from last quarter’s 19% and last year’s 30%. As with any company, but even more crucially for TSLA, much of the market’s reaction will depend upon the company’s guidance, particularly about whether margins might rise sufficiently to allow profit upgrades.
If TSLA was a normal stock, statistics like those should make investors extraordinarily concerned about the potential for disappointment. But TSLA is anything but a normal stock. We’ve long asserted that TSLA is a “faith-based” stock. It has a large cadre of zealous advocates whose quasi-religious faith in TSLA and its founder have indeed been richly rewarded. Thus, it is always difficult to divine what might occur next in such an eclectic name. That is why we turn to the options market for assistance.
At-money options expiring on Friday are currently trading with an implied volatility of about 117%. That implies that TSLA will average roughly 7% moves for the coming two days. Bear in mind that moves like this are typical, if not modest, for TSLA after earnings. On the day following earnings, the last few moves for TSLA have been -9.75%, +10.97%, -6.65%, +9.78%, +3.23% and -11.55%. It would be quite imprudent to expect much below the current pricing.
Implied Volatility Term Structure for TSLA Options
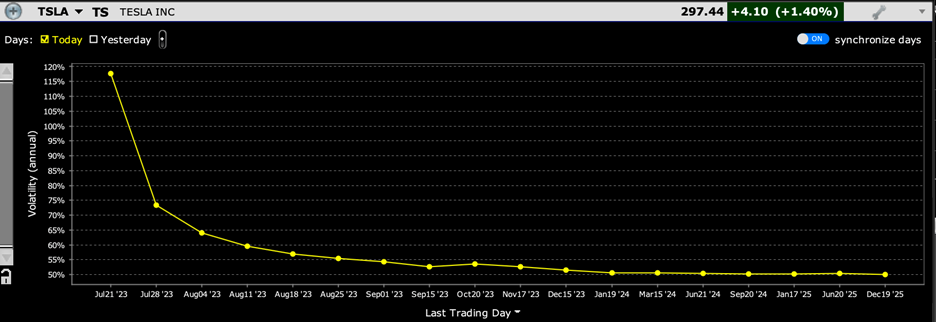
Source: Interactive Brokers
The IBKR Probability Lab shows some modest caution ahead of this afternoon’s report. With TSLA trading around $298, the peak probability implied by options expiring Friday is for a modest decline to the $290-$292 range. Perhaps even some of the most faithful are hedging their bets:
IBKR Probability Lab for TSLA Options Expiring July 21, 2023
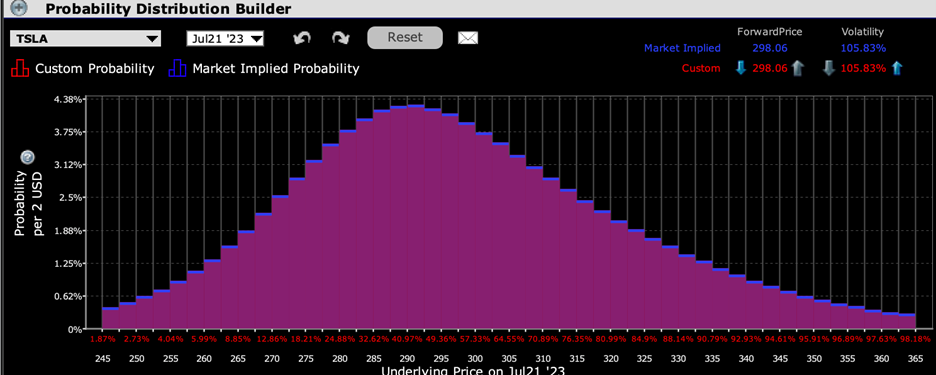
Source: Interactive Brokers
Given the minor risk aversion displayed by the above graph, it is somewhat to surprising to see that the lowest implied volatilities for this week’s options occur around $280, a bit more than 5% below current levels. We are quite used to seeing relatively symmetrical skews in TSLA, as shown in the August options (orange line below). That is not surprising for a stock that is all about price appreciation. It is also not surprising that there is no shortage of buyers of above market calls, either from the faithful or those hedging short positions. But is interesting that the cheapest options (on an implied volatility basis) are those that would hedge against the sort of decline that we saw last quarter.
Multi-Expiry Options Skew for TSLA Options, July 21 (yellow), July 28 (green), August 18 (orange)
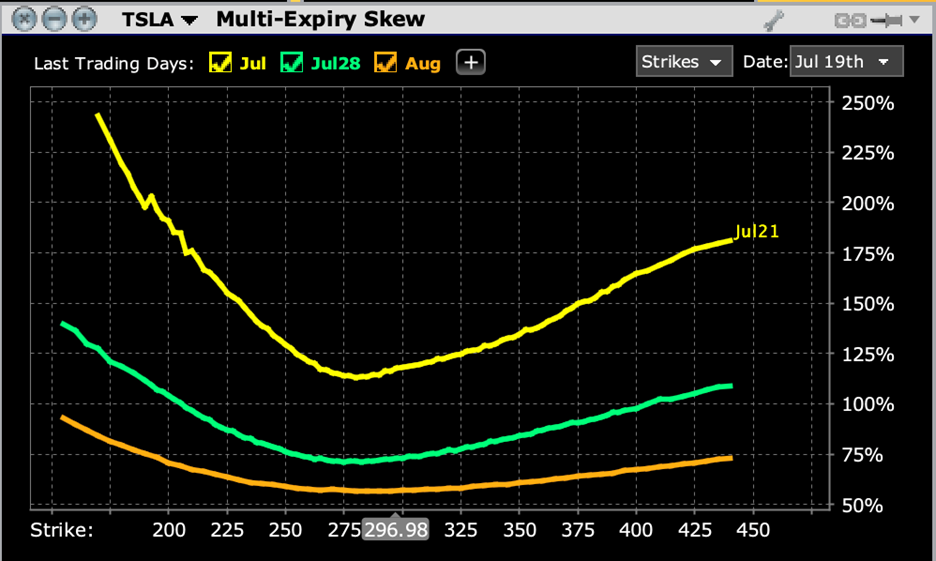
Source: Interactive Brokers
Could it be that TSLA options show investors to be simultaneously cautious AND sanguine about today’s earnings report? For a normal stock, that might be an irresolvable contradiction. For TSLA, however, it’s just another day at the office.
Disclosure: Interactive Brokers
The analysis in this material is provided for information only and is not and should not be construed as an offer to sell or the solicitation of an offer to buy any security. To the extent that this material discusses general market activity, industry or sector trends or other broad-based economic or political conditions, it should not be construed as research or investment advice. To the extent that it includes references to specific securities, commodities, currencies, or other instruments, those references do not constitute a recommendation by IBKR to buy, sell or hold such investments. This material does not and is not intended to take into account the particular financial conditions, investment objectives or requirements of individual customers. Before acting on this material, you should consider whether it is suitable for your particular circumstances and, as necessary, seek professional advice.
The views and opinions expressed herein are those of the author and do not necessarily reflect the views of Interactive Brokers, its affiliates, or its employees.
Disclosure: Probability Lab
The projections or other information generated by the Probability Lab tool regarding the likelihood of various investment outcomes are hypothetical in nature, do not reflect actual investment results and are not guarantees of future results. Please note that results may vary with use of the tool over time.
Disclosure: Options Trading
Options involve risk and are not suitable for all investors. Multiple leg strategies, including spreads, will incur multiple commission charges. For more information read the "Characteristics and Risks of Standardized Options" also known as the options disclosure document (ODD) or visit ibkr.com/occ


Join The Conversation
If you have a general question, it may already be covered in our FAQs. If you have an account-specific question or concern, please reach out to Client Services.