


After last week’s whipsaw action in both bonds and stocks, I began to see some commentary about how an extreme reading in the put/call ratios presaged Friday’s stunning rally in equities. On the surface, it’s hard to disagree with that observation – the ratio indeed reached an extreme on Wednesday – but the track record of that contrary indicator is far from perfect.
The rationale for the put/call ratio to be considered a contrary indicator is quite sound. When markets reach extreme levels of sentiment – whether bullish or bearish – it can be typical for traders to bet heavily on one side or the other. When markets are bearish, it is reasonable to expect traders to favor puts over calls, and vice versa when markets are bullish. If those preferences reach an extreme, it can indicate that the move is excessive or reaching a level of exhaustion. Thus, high readings of the put/call ratio are considered bullish signals and low readings are considered bearish.
One problem with using put/call indicators is that there is little consensus about which one to use. Some prefer to use exchange specific measures (e.g. Cboe only) while some focus only on indices or stocks. My preferred measure is the US Composite Put/Call Ratio. This is a broad measure, including equity and index options traded on all exchanges. It seems to be the least “cherry-picked” data of the bunch.
Another issue is that the ratios can be very volatile on a daily basis. I prefer to smooth out the extremes with a 21-day moving average. That is roughly the number of trading days in a given month, so putting daily fluctuations into perspective against a medium-term trend can be quite helpful.
1-Year Chart, Composite Put/Call Ratio (white), 21-day Moving Average (magenta), SPX (orange)
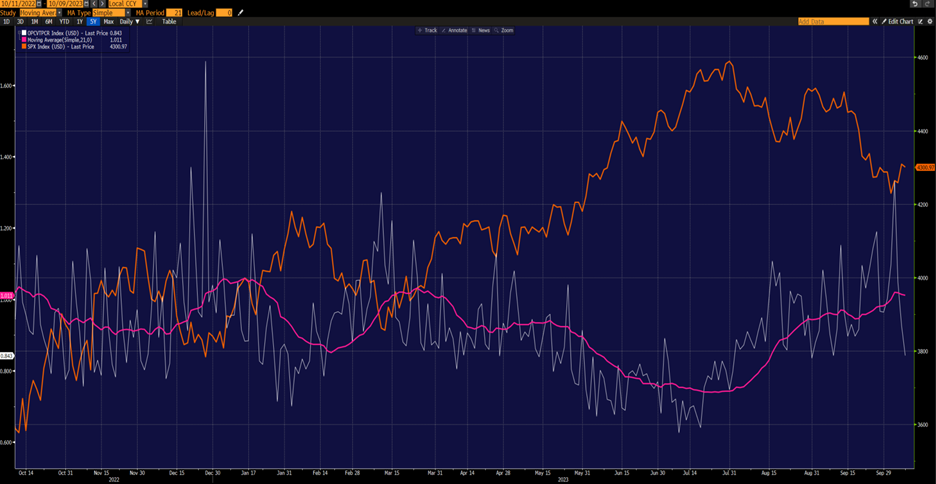
Source: Bloomberg
When we look at the put/call ratio over the past year, it is apparent that Wednesday’s ratio was among the highest we’ve seen over that period. In fact, it exceeded the spike that occurred at the worst of the March banking crisis, though it was below the extreme levels seen at the end of last year. Both proved to be buying opportunities. Does Wednesday’s spike signal a similar opportunity?
Traders certainly seemed to think so on Friday, but the experience beyond the past year is decidedly mixed. When we look at a 5-year chart, for example, we see that in 2021 we saw persistently low levels of the ratio – remember, that was a year when the public embraced call buying in an unprecedented manner – punctuated by downward spikes, yet none proved to be a decent time to sell stocks. Interestingly, the decline that began in January 2022 was accompanied by higher levels of the ratio. During 2022 we saw two spikes of similar magnitude to last week’s, one in early June, one in late September. The former move was a good opportunity for traders as the S&P 500 (SPX) moved higher from mid-July through mid-August. That rally evaporated, however, leading to the next spike in late September. SPX did indeed form a lasting bottom a couple of weeks later. (Interestingly, SPX did not exceed that August high until June of this year, and we are trading at nearly identical levels today.)
5-Year Chart, Composite Put/Call Ratio (white), 21-day Moving Average (magenta), SPX (orange)
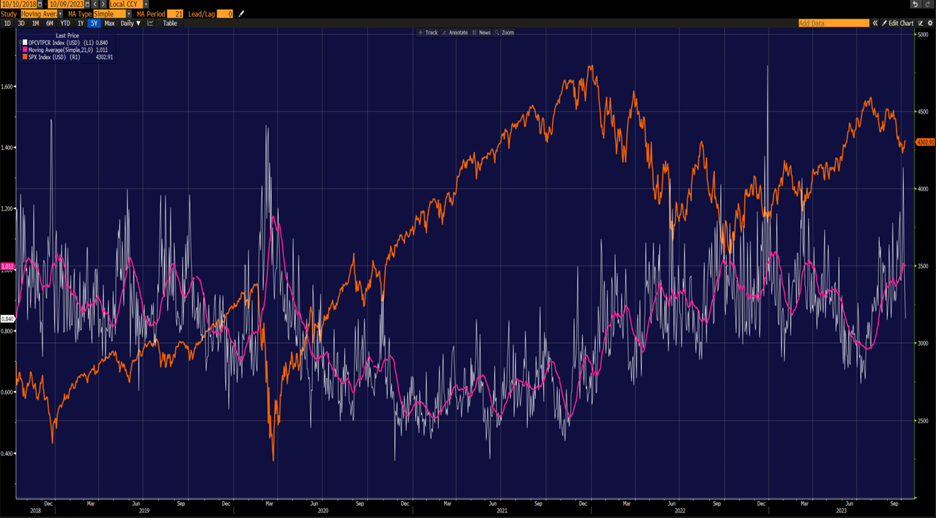
Source: Bloomberg
In those cases we see that the spikes preceded market rallies, but not immediately, and that those rallies either proved to be false (as in July-August 2022) or followed by some rocky weeks before truly powering upward (October-December 2022)
For those who want to look back a bit further, we did a similar analysis of the 2017-2019 period in a piece published in September 2022. To summarize:
The ratio was an extraordinary contrary indicator prior to “Volmageddon” – the sharp drop in stocks and blow-up in volatility that occurred in February 2018. Yet it failed miserably in October of that year, the time that might be the closest parallel to our own. We see the ratio spike at that time, only to abate just as SPX plunged in December. We then see it spike again just as the selloff was ending and stock prices began a substantial bounce.
Our conclusion from our September 2022 piece remains in effect today:
The put/call ratio can be a very useful tool – one that I consult often. But its messages are far from foolproof, and its false messages can be costly. Use with care.
Join The Conversation
If you have a general question, it may already be covered in our FAQs. If you have an account-specific question or concern, please reach out to Client Services.
Leave a Reply
Disclosure: Interactive Brokers
The analysis in this material is provided for information only and is not and should not be construed as an offer to sell or the solicitation of an offer to buy any security. To the extent that this material discusses general market activity, industry or sector trends or other broad-based economic or political conditions, it should not be construed as research or investment advice. To the extent that it includes references to specific securities, commodities, currencies, or other instruments, those references do not constitute a recommendation by IBKR to buy, sell or hold such investments. This material does not and is not intended to take into account the particular financial conditions, investment objectives or requirements of individual customers. Before acting on this material, you should consider whether it is suitable for your particular circumstances and, as necessary, seek professional advice.
The views and opinions expressed herein are those of the author and do not necessarily reflect the views of Interactive Brokers, its affiliates, or its employees.
Disclosure: Options (with multiple legs)
Options involve risk and are not suitable for all investors. For information on the uses and risks of options, you can obtain a copy of the Options Clearing Corporation risk disclosure document titled Characteristics and Risks of Standardized Options by clicking the link below. Multiple leg strategies, including spreads, will incur multiple transaction costs. "Characteristics and Risks of Standardized Options"
Disclosure: Options Trading
Options involve risk and are not suitable for all investors. Multiple leg strategies, including spreads, will incur multiple commission charges. For more information read the "Characteristics and Risks of Standardized Options" also known as the options disclosure document (ODD) or visit ibkr.com/occ


Is the time series for the Put Call ratio you used stationary?
Hello Warren, we haven’t run the statistical tests to determine it.
good