

")


Key takeaways
Market history
Markets, over more than 120 years, have experienced a long-term advance despite war, recession, oil shocks, political assassinations, and much more.
Military conflict
Military conflicts test investors’ resolve to stick to their investment plan, but history suggests these events have not derailed the long-term growth of markets.
Differences from 1973
The market fall after the Yom Kippur War in 1973 may be concerning to investors given the parallels to today’s conflict, but there are very significant differences.
History is comprised of challenging times. As a global market strategist, it’s my job to talk about these historic events in the context of the markets, and to offer some perspective for investors. Unfortunately, it’s time to do so once again.
Markets, over more than 120 years, have experienced a long-term advance despite war, recession, oil shocks, political assassinations, and much more. While military conflicts test investors’ resolve to stick to their investment plan, history suggests these events have not derailed the long-term growth of financial markets. I implore investors to maintain a long-term perspective.
Stock market returns following geopolitical conflicts
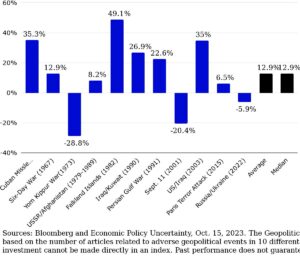
If there’s a factor that impacts market performance, there’s an index to measure it. Geopolitical risk is no exception. The chart below illustrates 11 points in history where we experienced a peak in the Geopolitical Risk Index, and it shows the return of the S&P 500 Index 12 months after that peak. In most cases, the stock market rose significantly in the year following peak geopolitical risk.
Stocks have made significant returns in the 12 months following peak geopolitical risk
S&P 500 Index returns 12 months after a peak in the Geopolitical Risk Index

A closer look at the Yom Kippur War
The biggest outlier in the above chart is the Yom Kippur War in 1973, which was followed by a severe recession and a sharp decline in markets. This may be concerning to investors given the parallels to today’s conflict, but there are very significant differences:
- The 1970s recession was fueled by the Arab oil embargo against the United States. But today, the US is significantly more energy independent than it was back then.
- In the 1970s, inflation was beginning to rise. But in the current instance, inflation peaked well over a year ago — the US Consumer Price Index hit 9.1% in June 2022, falling to 3.7% in September 2023.1
- The Federal Reserve appears to not be suffering from a credibility gap as it was in the 1970s. Inflation expectations are very well anchored in the US.
Footnotes
- 1Source: US Bureau of Labor Statistics, as of Oct. 12, 2023
—
Originally Posted October 20, 2023
Military conflicts haven’t derailed the long-term growth of stocks by Invesco US
Important information
NA3172239
Investors should consult a financial professional before making any investment decisions. This does not constitute a recommendation of any investment strategy or product for a particular investor. Investors should consult a financial professional before making any investment decisions.
All investing involves risk, including the risk of loss.
Past performance does not guarantee future results.
Investments cannot be made directly in an index.
In general, stock values fluctuate, sometimes widely, in response to activities specific to the company as well as general market, economic and political conditions.
The Consumer Price Index (CPI) measures change in consumer prices as determined by the US Bureau of Labor Statistics. Core CPI excludes food and energy prices while headline CPI includes them.
The S&P 500® Index is a market-capitalization-weighted index of the 500 largest domestic US stocks. The S&P 500 Total Return Index assumes that all cash distributions are reinvested.
The opinions referenced above are those of the author as of Oct. 16, 2023. These comments should not be construed as recommendations, but as an illustration of broader themes. Forward-looking statements are not guarantees of future results. They involve risks, uncertainties and assumptions; there can be no assurance that actual results will not differ materially from expectations.
Disclosure: Invesco US
This does not constitute a recommendation of any investment strategy or product for a particular investor. Investors should consult a financial advisor/financial consultant before making any investment decisions. Invesco does not provide tax advice. The tax information contained herein is general and is not exhaustive by nature. Federal and state tax laws are complex and constantly changing. Investors should always consult their own legal or tax professional for information concerning their individual situation. The opinions expressed are those of the authors, are based on current market conditions and are subject to change without notice. These opinions may differ from those of other Invesco investment professionals.
NOT FDIC INSURED
MAY LOSE VALUE
NO BANK GUARANTEE
All data provided by Invesco unless otherwise noted.
Invesco Distributors, Inc. is the US distributor for Invesco Ltd.’s Retail Products and Collective Trust Funds. Institutional Separate Accounts and Separately Managed Accounts are offered by affiliated investment advisers, which provide investment advisory services and do not sell securities. These firms, like Invesco Distributors, Inc., are indirect, wholly owned subsidiaries of Invesco Ltd.
©2024 Invesco Ltd. All rights reserved.
Disclosure: Interactive Brokers
Information posted on IBKR Campus that is provided by third-parties does NOT constitute a recommendation that you should contract for the services of that third party. Third-party participants who contribute to IBKR Campus are independent of Interactive Brokers and Interactive Brokers does not make any representations or warranties concerning the services offered, their past or future performance, or the accuracy of the information provided by the third party. Past performance is no guarantee of future results.
This material is from Invesco US and is being posted with its permission. The views expressed in this material are solely those of the author and/or Invesco US and Interactive Brokers is not endorsing or recommending any investment or trading discussed in the material. This material is not and should not be construed as an offer to buy or sell any security. It should not be construed as research or investment advice or a recommendation to buy, sell or hold any security or commodity. This material does not and is not intended to take into account the particular financial conditions, investment objectives or requirements of individual customers. Before acting on this material, you should consider whether it is suitable for your particular circumstances and, as necessary, seek professional advice.


Join The Conversation
If you have a general question, it may already be covered in our FAQs. If you have an account-specific question or concern, please reach out to Client Services.