


![[Gamma] Scalping Please](https://ibkrcampus.com/wp-content/smush-webp/2024/04/tir-featured-8-700x394.jpg.webp "[Gamma] Scalping Please")


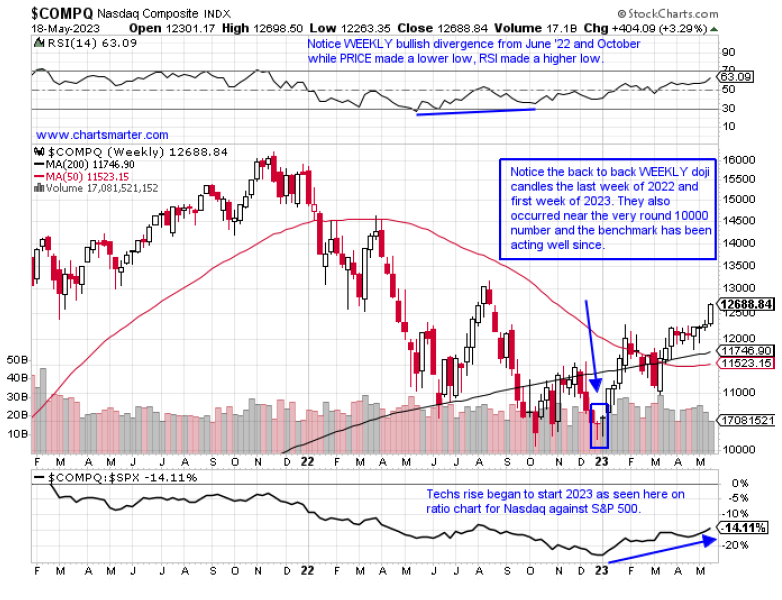
Before we dig in the following information should not be considered investment advice and I have no positions in any names that will be mentioned in this note. But I wanted to convey how powerful the signal of the doji candle can be at potentially calling near term tops and bottoms. When it presents itself there is a good change that a change in the prevailing direction is about to occur. When it happens after a prolonged downtrend it could signal selling pressure is abating and conversely it may state after a long uptrend that the instrument may be ready for a healthy pause. Below is the WEEKLY chart of the Nasdaq that registered back-to-back doji candles near the very round 10000 number after a swift rejection from 16000 in late 2021. So far it was an accurate call that a short term bottom was in place.
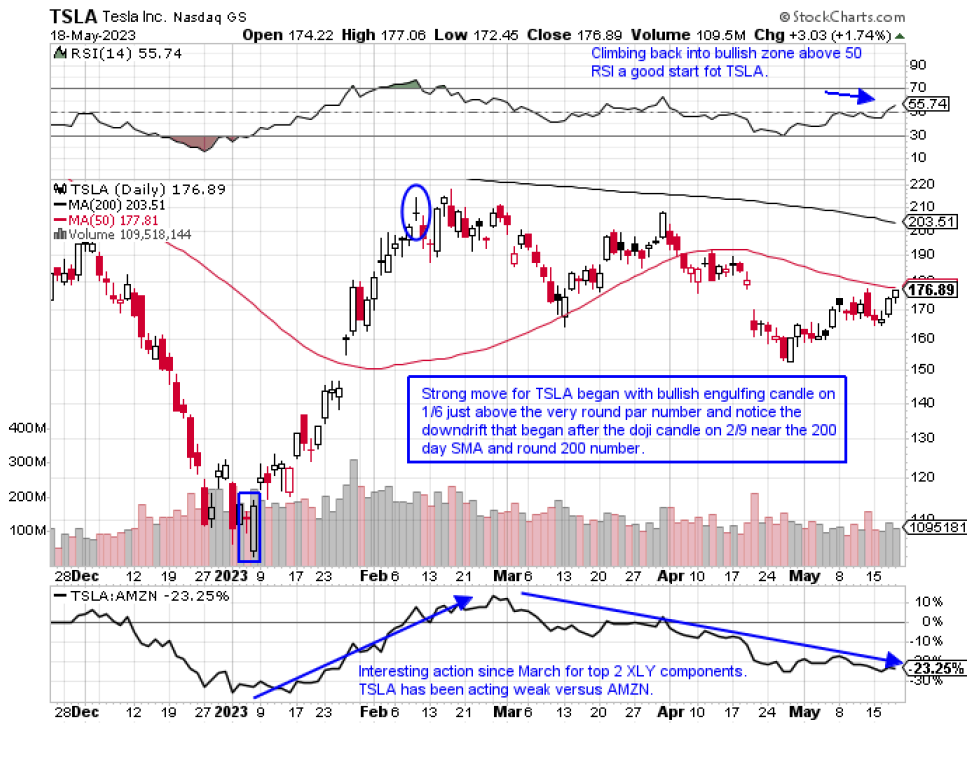
Below is the daily chart of TSLA, a widely followed name in not just the auto space, but the market in general. This is an example how the doji candle called a short-term top after doubling between the rough round numbers of 100-200. We know the markets had a very healthy January which lifted most boats and TSLA was no exception. The doji candle on 2/9 should have in the very least had shareholders thinking of shaving some of their holdings. It had after all witnessed a spirted run and was nearing a downward sloping 200-day SMA. Notice as the Nasdaq has climbed back above its January peak, TSLA remains well below it.
Doji candles are rare on most time frames, but on WEEKLY and MONTHLY charts even more so. Below we look at the semiconductors which for the most part have done a lot of the heavy lifting for a resurgent technology space in 2023.
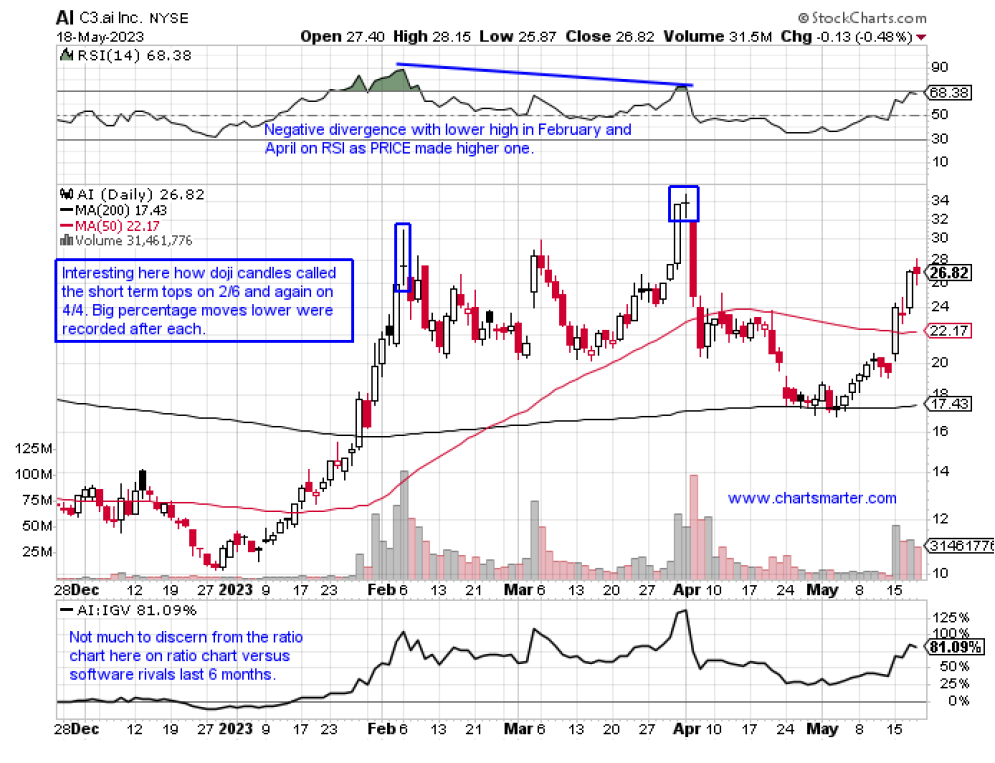
With all the craze and fascination regarding the AI space a software name at the forefront with a clever symbol was subject to the doji candle. This happened not once but twice on 2/6 and then again on 4/4 which saw the stock undergo a PRICE hiccup immediately thereafter. During February and March it traded around the rough 20-30 round numbers and the April doji saw the PRICE of AI decline by 50% until it found some comfort near its 200 day SMA.
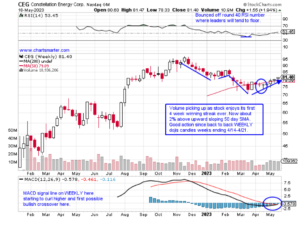
And for the last example we peek at the WEEKLY chart of CEG. This is a utility play which has a footprint in the nuclear arena. This name started trading in early 2022 and enjoyed a very nice move from below 40 to almost touching the very round par number in Q4 2022. There was no doji candle to signal topping action but recently we saw consecutive WEEKLY dojis candles after a 20% decline and that seems to have given the stock some life. It has recaptured its 50 WEEK SMA and is now higher over the last 5 weeks. A potential double bottom is in place but of course nothing is guaranteed.

—
Originally Posted May 22, 2023
Disclosure: ChartSmarter
The opinions expressed by the author are his own. Trades or positions discussed by the author are neither a solicitation to buy or sell a security, nor are they investment advice. Recipients should always do their own due diligence before buying or selling a security. Every reader is responsible for his/her decision to buy or sell a security.
Disclosure: Interactive Brokers
Information posted on IBKR Campus that is provided by third-parties does NOT constitute a recommendation that you should contract for the services of that third party. Third-party participants who contribute to IBKR Campus are independent of Interactive Brokers and Interactive Brokers does not make any representations or warranties concerning the services offered, their past or future performance, or the accuracy of the information provided by the third party. Past performance is no guarantee of future results.
This material is from ChartSmarter and is being posted with its permission. The views expressed in this material are solely those of the author and/or ChartSmarter and Interactive Brokers is not endorsing or recommending any investment or trading discussed in the material. This material is not and should not be construed as an offer to buy or sell any security. It should not be construed as research or investment advice or a recommendation to buy, sell or hold any security or commodity. This material does not and is not intended to take into account the particular financial conditions, investment objectives or requirements of individual customers. Before acting on this material, you should consider whether it is suitable for your particular circumstances and, as necessary, seek professional advice.

Join The Conversation
If you have a general question, it may already be covered in our FAQs. If you have an account-specific question or concern, please reach out to Client Services.