

")


This morning, I was asked some questions about the relative outperformance of large-cap stocks. Some of the facets of relative performance have been well-documented: that mega-cap tech stocks have led the way, and that cap-weighted indices have vastly outperformed their equal-weighted counterparts. The question, of course, is why, and whether that situation is likely to persist. But first, let’s let a few charts tell the initial story.
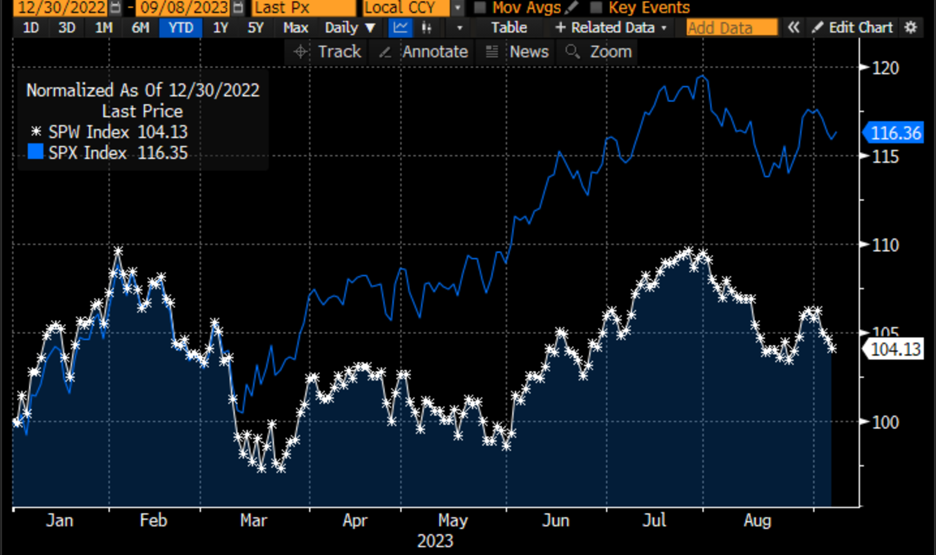
Each of the following charts normalize major indices and sub-indexes to the start of the year. First, we have the S&P 500 (SPX) vs. its equal-weighted version (SPW). SPX is up over 16% YTD, while SPW is up just over 4%:
Normalized Year-to-Date, SPX (blue), SPW (white)
Source: Bloomberg
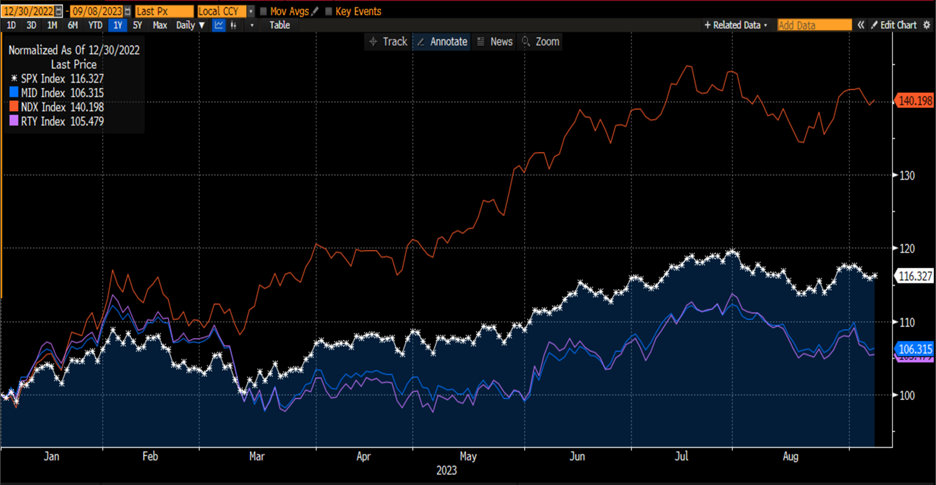
Next, we have a normalized view of four key US indices: SPX, NASDAQ 100 (NDX), S&P Midcap 400 (MID), and Russell 2000 (RTY). The outperformance of the top-heavy, tech heavy NDX has been well-reported, but the relative stagnation of both MID and RTY has been generally overlooked. NDX is up over 40% so far this year, well above SPX, while MID and RTY languish in the +5-6% range.
Normalized Year-to-Date, SPX (white), MID (blue), NDX (red), RTY (purple)
Source: Bloomberg
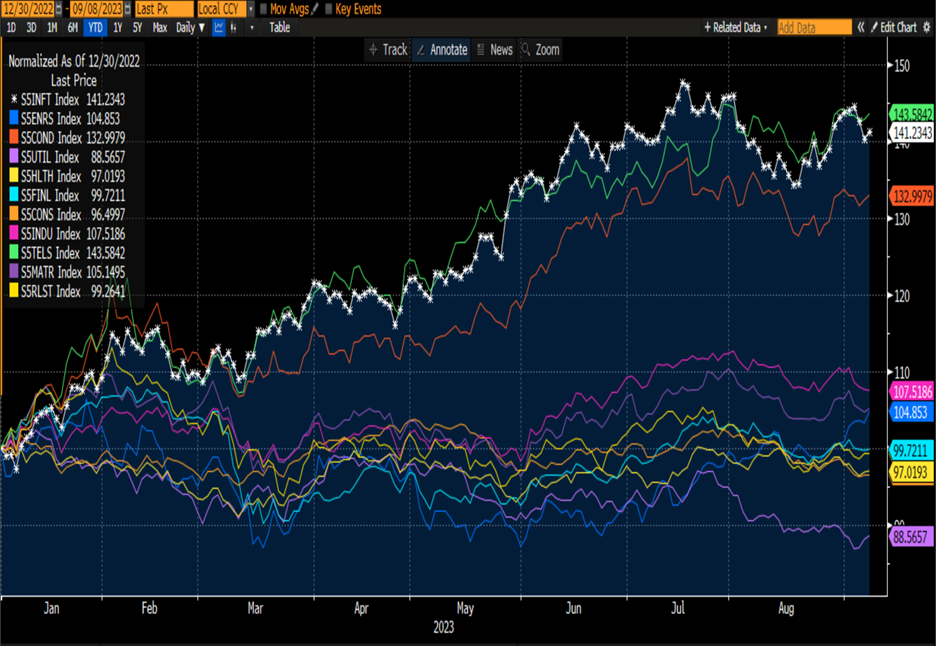
Finally, a similar (but busy) chart of the 11 sectoral sub-indices of the S&P 500 puts the relative dominance of certain sectors into stark perspective. Information Technology, featuring Microsoft (MSFT) and Nvidia (NVDA), Communications Services, featuring Alphabet (GOOG, GOOGL), Meta Platforms (META) and Netflix (NFLX), and Consumer Discretionary, featuring Amazon (AMZN) and Tesla (TSLA) lead by a wide margin with +30-40% year-to-date gains. Meanwhile the other 8 sectors meander around the unchanged line, with Materials and Energy being the best of the rest, while rate-sensitive sectors like Real Estate and especially Utilities are unsurprisingly down for the year.
Normalized Year-to-Date S&P 500 Sector Indices, Information Technology (S5INTL, white), Energy (S5ENRS, blue), Consumer Discretionary (S5COND, orange), Utilities (S5UTIL, purple), Health Care (S5HLTH, yellow), Financials (S5FINL, light blue), Consumer Staples (S5CONS, orange), Industrials (S5INDU, magenta), Communications Services (S5TELS, green), Materials (S5MATL, purple), Real Estate (S5RLST, yellow)
Source: Bloomberg
Now that we have seen some vivid displays about the types and amounts of outperformance, let’s circle back to the questions about why this occurred and whether it might persist. I believe that four factors were key:
- As passive strategies grow in popularity, that biases us to bigger stocks and reinforces their outperformance.
- Large cap tech was a huge underperformer going into year-end 2022, so the gains are outsized on a YTD basis. That said, they are also quite substantial, roughly +20%, on a one-year basis.
- Much of this year’s performance has been about AI enthusiasm, which disproportionately benefitted the largest tech stocks, creating a top-down set of winners this year. These include behemoths like NVDA, MSFT, GOOGL and more.
- There is a consensus among many investors that the largest stocks have relatively bulletproof earnings power. Many of them certainly have competitive moats. For example, is difficult to see the duopolies in computer operating systems (MSFT, AAPL), mobile operating systems (AAPL, GOOGL) being easily disrupted. Yet we have seen TSLA’s competitive edge threatened by a wide range of auto companies playing catch-up, and the recent events involving China and AAPL show cracks in that model.
The results demonstrate a real conundrum for investors. Many fell in love with tech stocks during the low interest rate regime of prior years, when “TINA”, an acronym for “There Is No Alternative”, was a key mantra. Cash, short-term fixed income, and other low-risk alternatives paid nearly nothing. Now it is quite easy for ordinary investors to earn 4-5% interest on these products. Quite frankly, that compares quite well on a risk-adjusted basis to the average stock.
That means that the outperformance of certain stocks and sectors attracts more risk capital to them. If your choices are riding winners higher or adding fresh capital to stocks with cash-like returns, it is understandable why money continues to flow to the leaders.
Can this continue? Sure. It goes back to the inertial market premise, that a market or group of stocks stays in motion until acted upon by an external force. Reversion to the mean is possible, but it would presumably need a catalyst. Could China vs. AAPL be that sort of force? Perhaps. Could it be something more prosaic, like those needing to resume student loan payments selling their favorite stocks to raise cash? Quite possibly. Let’s see how we handle factors like those over the coming weeks.
Join The Conversation
If you have a general question, it may already be covered in our FAQs. If you have an account-specific question or concern, please reach out to Client Services.
Leave a Reply
Disclosure: Interactive Brokers
The analysis in this material is provided for information only and is not and should not be construed as an offer to sell or the solicitation of an offer to buy any security. To the extent that this material discusses general market activity, industry or sector trends or other broad-based economic or political conditions, it should not be construed as research or investment advice. To the extent that it includes references to specific securities, commodities, currencies, or other instruments, those references do not constitute a recommendation by IBKR to buy, sell or hold such investments. This material does not and is not intended to take into account the particular financial conditions, investment objectives or requirements of individual customers. Before acting on this material, you should consider whether it is suitable for your particular circumstances and, as necessary, seek professional advice.
The views and opinions expressed herein are those of the author and do not necessarily reflect the views of Interactive Brokers, its affiliates, or its employees.


Good article. Thanks!
Thank you, Pete. We hope you’ll continue to follow Traders’ Insight.