Study Notes:
A 10-K report is an annual filing that provides a comprehensive overview of a company’s financial performance, business operations, risk factors, and audited financial statements. It offers a more detailed and in-depth analysis of the company’s activities over the past fiscal year.
On the other hand, a 10-Q report is a quarterly filing that provides a snapshot of the company’s financial results, including unaudited financial statements and a management discussion and analysis (MD&A) section. The 10-Q report offers an update on the company’s performance, but with less comprehensive information compared to the 10-K report.
Where do you find these reports?
Many companies make their 10-K and 10-Q reports available on their investor relations or financial reports section of their official website.
Several financial news websites, such as Bloomberg, Yahoo Finance, or Google Finance, provide access to company filings. These platforms often include a company’s 10-K and 10-Q reports within their company profiles or filing sections.
U.S. Securities and Exchange Commission (SEC) Website: The SEC’s Electronic Data Gathering, Analysis, and Retrieval (EDGAR) system is a comprehensive database of publicly available corporate filings, including 10-K and 10-Q reports.
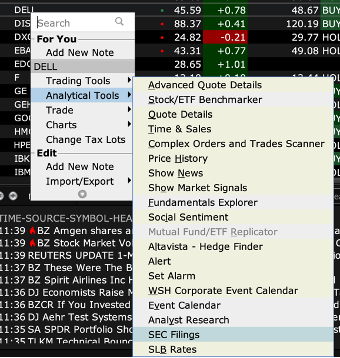
And within TWS, just right click on a ticker and select Analytical Tools > SEC Filings. This will take you directly to the EDGAR search results. Let’s open a 10Q report and take a look.

What to look for in the reports?
Value investors may find information on revenue growth, profitability, and cash flow generation in the income statement and cash flow statement sections of the 10-K, 10-Q reports. They generally focus on these metrics to assess the company’s ability to generate sustainable earnings and cash flow.
If you click on the Sections icon at the top left, you will see a menu appear whereby you can select Financial Statements. I’ll click on Income – and here you’ll see the numbers for the current and previous quarters.
OK first let’s look at Balance sheet strength.
The balance sheet section of the reports provides details on the company’s assets, liabilities, and shareholder equity. Value investors examine metrics like debt levels and liquidity to evaluate the company’s financial health and its ability to meet its obligations.
Next let’s look at competitive positioning.
This information about the company’s market share, competitive advantage, and industry dynamics can be found in the business overview or management discussion sections of the reports. Understanding the company’s position within its industry helps investors assess its long-term prospects and sustainability. If you access the Table of Contents, you can jump directly to the Management’s Discussion section.
Here’s also where you’ll find discussions of Management and Governance. This includes sections dedicated to management discussion, executive compensation, and corporate governance. Value investors analyze these sections to evaluate the quality and integrity of the management team and ensure their interests are aligned with shareholders’.
Within these sections you’ll receive insights into trends and uncertainties, market size, and competitive landscape. Investors study this information to understand the company’s market potential and its ability to navigate industry challenges.
Within this report you’ll see quantitative and qualitative disclosures about market risk. You’ll want to read the narrative in detail. This may highlight foreign currency exposure, interest rate risk, dividend risk to name a few.
Investors can calculate valuation metrics using information from the income statement, balance sheet, and cash flow statement sections. Metrics such as: price-to-earnings ratio, price-to-book ratio, earnings per share or perform discounted cash flow analysis to determine if the stock is over- or undervalued relative to its intrinsic value.
Make sure to look at the footnotes too!
The report usually contains sections on dividends and capital allocation policies. Review these sections to assess the company’s history of returning capital to shareholders through dividends or share buybacks. This reflects management’s confidence in the company and its commitment to maximizing shareholder value.


Join The Conversation
If you have a general question, it may already be covered in our FAQs. If you have an account-specific question or concern, please reach out to Client Services.