


Study Notes:
Let’s build a custom market scanner in TWS Mosaic using a value.
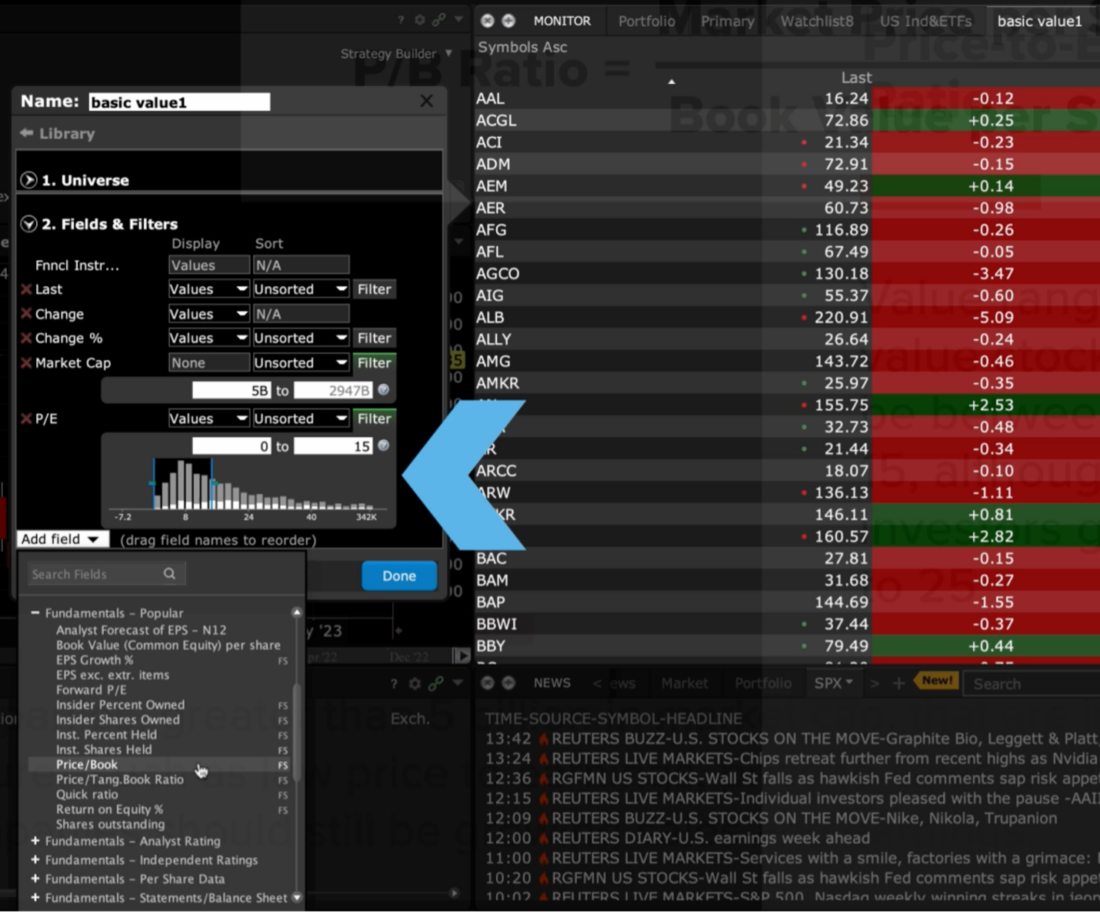
To Access Market Scanners within the Monitor Panel in Mosaic, just click on the ‘+’ sign. Let’s create a new scanner, name it, select a universe of stocks, and add some filter criteria.
Keep in mind that these value ranges are just examples for this course and may not be suitable for all investors or market conditions.
Let’s build a large-cap value scanner using some of the filtering variables found within TWS.
First – let’s find large companies, greater than 5 billion in market cap, that are inexpensive by traditional measures such as low price to earnings, price to sales, and price to book. These companies should still be growing sales and earnings. First, I am going to filter for Market Cap. To add this field – go to Add Field near the bottom, select the arrow and select Fundamentals – Popular. I’ll select Market Cap. I’ll click on the Filter button to the right and select a range.
Now before we access the Price-to-Earnings ratio, let’s discuss how it’s calculated. P/E Ratio is calculated by dividing a company’s current stock price by its earnings per share (EPS). Calculate EPS by determining the company’s earnings, subtract the company’s preferred dividends from its net income, and then divide the earnings by the number of shares outstanding.
Let’s say a company has net income of $2 billion, it pays $400 million in preferred dividends, and it has 800 million shares outstanding. Here’s how we’d calculate its EPS:
($2 billion-$400 million) / 800 million shares = $2 per share
Now that we know the EPS, we can compute the P/E ratio. If the stock currently trades for $30 per share, then the P/E ratio would simply be $30 divided by $2, or 15.
$30 / $2 = 15
Let’s open the Fundamentals Popular section – and locate:
Price-to-Earnings Ratio – This is the most used valuation metric in the market, as it indicates how much investors are willing to pay for each dollar of earnings. Typically, a lower P/E ratio may indicate that a stock may be undervalued. Value ranges for value stocks may be between 0 and 15, although some investors go up to 25. So, let’s filter for that.
As we add variables – you’ll see stocks appearing in your scan result.
Now – let’s add:
Price-to-Book Ratio:
This is a measure of a company’s market value relative to its book value, which is the value of its assets minus liabilities. A business’s book value shows you how much a company should be worth, in theory, if you were to liquidate your assets. Value investors may look for companies with lower P/B ratios We’ll set Value ranges between 0 and 1.1.
Next Price-to-Sales Ratio:
Value investors are looking for cheap stocks, so if the price to sales ratio is .7 the stock is valued at 70 cents per dollar. This is calculated by taking a company’s market capitalization (the number of outstanding shares multiplied by the share price) and dividing it by the company’s total sales or revenue over the past 12 months. The lower the P/S ratio, the more attractive the investment. The Price/Sales ratio represents the amount an investor is willing to pay for a dollar generated from a particular company’s operations. We can find Price to Sales in the Fundamentals – Other section.
In TWS you cannot filter on this field, so let’s look for values 0 and 1.5.
As is the case with other ratios, the P/S ratio is of greatest value when it is used for comparing companies within the same sector.
There are more variables to choose from – but let’s start with these for now. =
When finished, click Done. Ok – here are the results!
Here’s a tip to see a larger panel – just double-click on the title section of the Monitor at the top and you’ll see it pop out. Then you can add more space between the columns.
There are more variables to choose from – but let’s start with these for now.
When finished, click Done. Ok – here are the results!
Here’s a tip to see a larger panel – just double-click on the title section of the Monitor at the top and you’ll see it pop out. Then you can add more space between the columns.
To filter this data even more – you can click on Edit Scanner and then export the data to an Excel spreadsheet. Then you can sort by sector, add formulas and more for further analysis.
TWS will save this custom scanner with the name you provided, so you can run it whenever you choose. Plus, you can add or remove the filter criteria as you learn more about value investing.
Fundamental Explorer
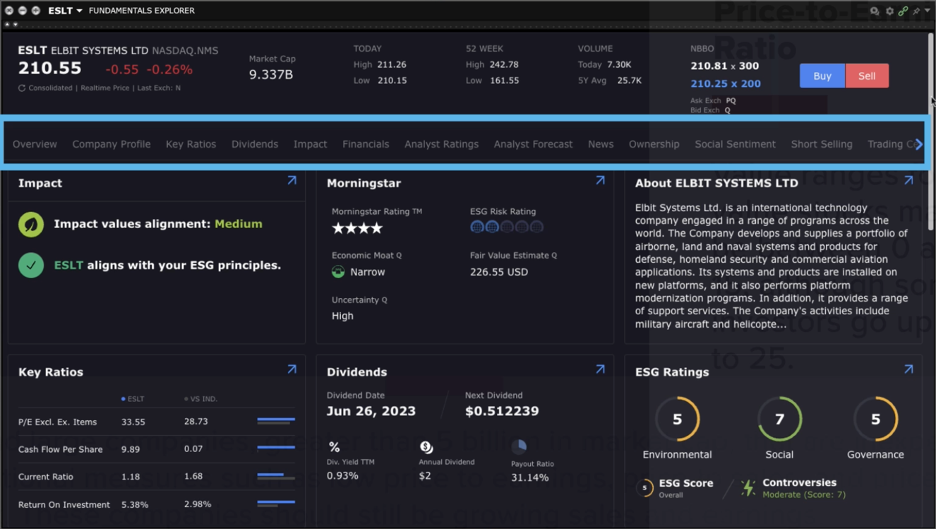
Now if you right click on a ticker, you can access the Fundamental Explorer. There’s a wealth of information listed here. It opens up showing market data at the top, market cap, today’s high and low, 52 week high and low, plus volume and NBBO.
Below that you’ll see a list of tabs that you can select from. It opens on the Overview tab. Here you can see the Morningstar rating, economic moat and fair value estimate.
See more key ratios below, dividends, financials, EPS forecast, News and more.
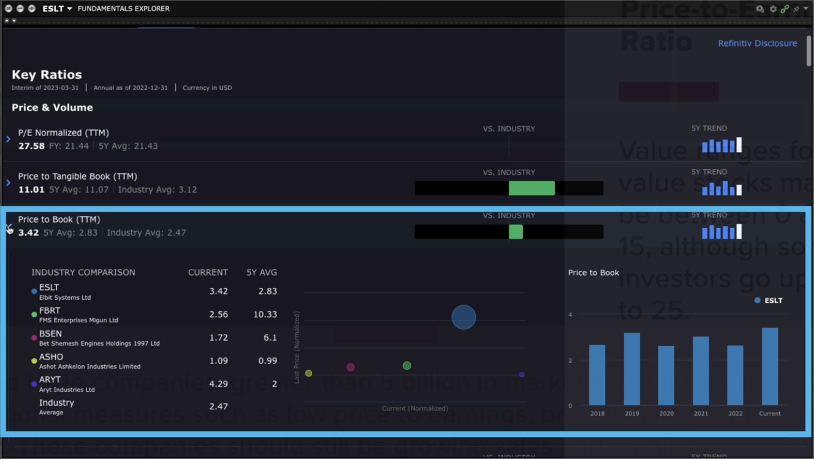
Let’s select the Key Ratios tab. Here you’ll find a slew of ratios, and if we select Price to Book you’ll see an industry comparison showing the current ratio and the 5 year average.
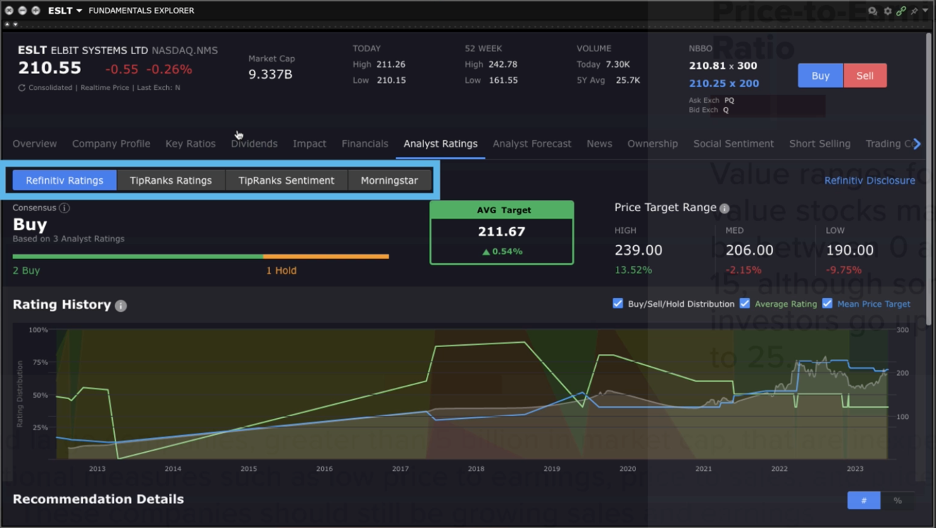
Back at the top, I’ll select Analyst Ratings. This shows Refinitive, TipRanks Ratings, TipRanks Sentiment and Morningstar. Within Morningstar, you can select from the menu on the left, Valuation, Economic Moat, which we will cover in a later lesson and a business description.
Back in the monitor panel, if you want to access the custom scanner if it is not displaying. Just click on the plus sign and select Mosaic Market Scanner, look under My Scanners and here it is right here. It saved all the filter criteria that we added.
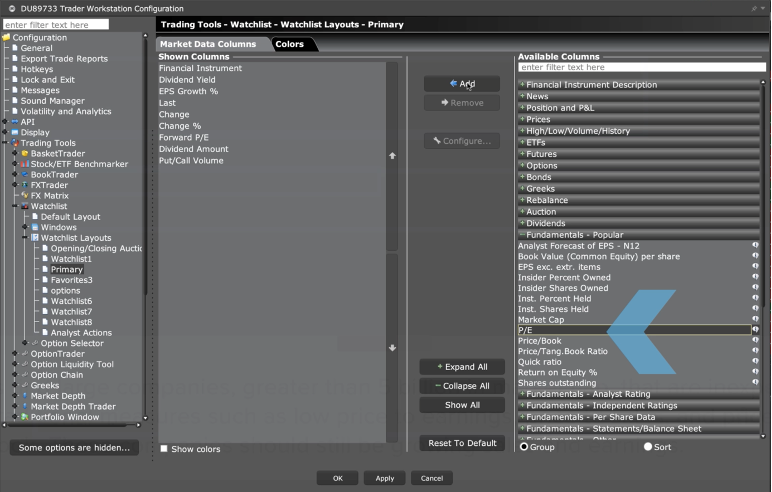
One last tip, you can customize any of your watchlist to just right click in the column headers, a menu will popup whereby you can select Manage Columns. Select variables from the list on the right and click the Add button in the middle. Everything on the left list is what will display in the watchlist. When done click Apply and Done. Now you will see that they appear in the watchlist, you can adjust the column sizes too so they are not bunched up.
Ok, that’s how you build a simple custom scanner in TWS.
Join The Conversation
If you have a general question, it may already be covered in our FAQs. If you have an account-specific question or concern, please reach out to Client Services.