


")


In this blog, we will learn to use the Seaborn Python package to create heatmaps that can be used by traders for tracking markets.
Our roadmap for this blog is:
- Seaborn for Python data visualization
- What is a heatmap?
- Use cases for heatmaps in finance
- Step-by-step Python code for creating heatmaps
- Display the single-day percentage price changes of stocks
- Display the correlation among the price changes of stocks
Other Python libraries for plotting heatmaps
In our previous blog, we talked about Data Visualization in Python using Bokeh. We now turn our eye towards another cool data visualization package in Python.
Seaborn for Python data visualization
Seaborn is a data visualization library based on Matplotlib. It provides a high-level interface for drawing attractive statistical graphs.
Seaborn is built on top of Matplotlib, and its graphics can be further tweaked using Matplotlib tools and rendered with any of the Matplotlib backends to generate publication-quality figures.
The types of plots that can be created using Seaborn include:
- Distribution plots
- Regression plots
- Categorical plots
- Matrix plots
- Time series plots
- Heatmaps
The plotting functions operate on Python data frames and arrays containing a whole dataset and internally perform the necessary aggregation and statistical model-fitting to produce informative plots. Some examples can be found here.
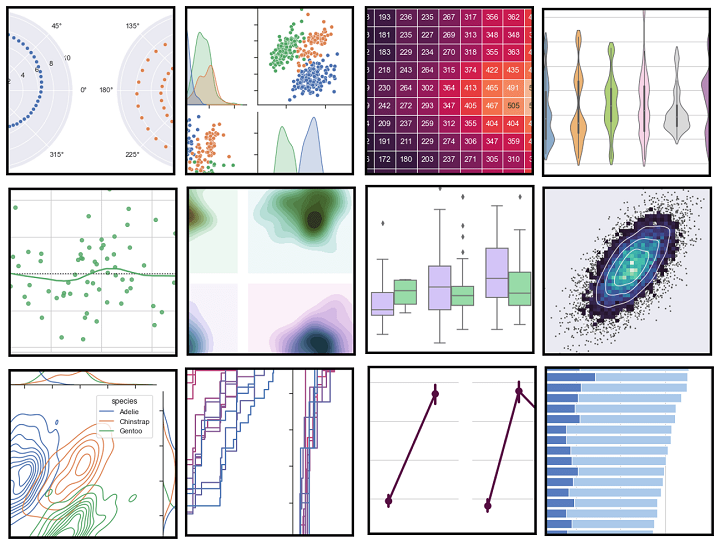
Source: Seaborn.pydata.org
What is a heatmap?
A heatmap is a two-dimensional graphical representation of data where the individual values that are contained in a matrix are represented as colours.
The Seaborn package allows the creation of annotated heatmaps which can be tweaked using Matplotlib tools as per the creator’s requirement.

Annotated Heatmap: Source http://seaborn.pydata.org/_images/spreadsheet_heatmap.png
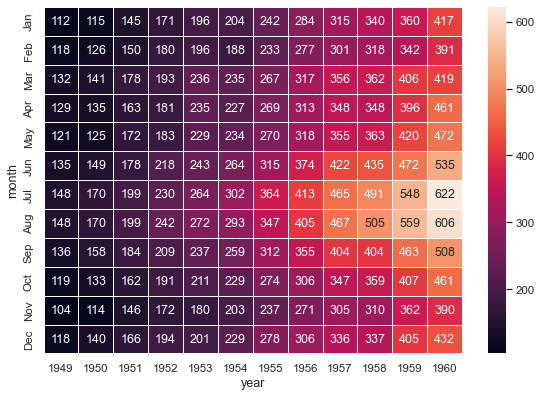
Use cases for heatmaps in finance
As discussed earlier, a heatmap is a matrix representation of the variables, which is coloured based on the intensity of the value. Hence, it provides an excellent visual tool for comparing various entities.
It is easy to create and customize, and intuitive to interpret. So it is used extensively when dealing with multiple assets in finance.
Some of the important use-cases where heatmaps provide powerful visualization are:
- Comparing the price changes, returns, etc. of various assets
- Checking the correlation among multiple stocks
Since heatmaps provide us with an easy tool to understand the correlation between two entities, they can be used to visualize the correlation among the features of a machine learning model. This may help in feature selection by eliminating highly correlated features.
Stay tuned for Part II to for Step-by-step Python code for creating heatmaps.
Originally posted on QuantInsti blog.
Disclosure: Interactive Brokers
Information posted on IBKR Campus that is provided by third-parties does NOT constitute a recommendation that you should contract for the services of that third party. Third-party participants who contribute to IBKR Campus are independent of Interactive Brokers and Interactive Brokers does not make any representations or warranties concerning the services offered, their past or future performance, or the accuracy of the information provided by the third party. Past performance is no guarantee of future results.
This material is from QuantInsti and is being posted with its permission. The views expressed in this material are solely those of the author and/or QuantInsti and Interactive Brokers is not endorsing or recommending any investment or trading discussed in the material. This material is not and should not be construed as an offer to buy or sell any security. It should not be construed as research or investment advice or a recommendation to buy, sell or hold any security or commodity. This material does not and is not intended to take into account the particular financial conditions, investment objectives or requirements of individual customers. Before acting on this material, you should consider whether it is suitable for your particular circumstances and, as necessary, seek professional advice.