

")


The article “Economic Momentum” first appeared on Alpha Architect blog.
Out of the hundreds of exhibits in the factor zoo, momentum was one of just five equity factors that met all the criteria (persistent, pervasive, robust, implementable, and intuitive) Andrew Berkin and I established in our book Your Complete Guide to Factor-Based Investing. Because of the strong empirical evidence, momentum—the tendency of assets that have performed well recently (e.g., over the prior year) to outperform assets in the same asset class that has performed poorly over the same period—continues to receive much attention from researchers.
While the original 1993 research on momentum by Narasimhan Jegadeesh and Sheridan Titman focused solely on U.S. common stock returns, momentum—both cross-sectional (which looks at the relative strength of a cross-section of markets, going long the assets with the most relative strength and short the assets with the least relative strength) and time-series, or trend (which goes long the assets that have been rising and short the assets that have been falling)—has been found pretty much everywhere: in global stocks, government and corporate bonds, commodities, currencies, stock portfolios, industries, countries, and even options.
Adding to the momentum literature, in his February 2015 NBER paper “Fundamentally, Momentum is Fundamental Momentum,” Robert Novy-Marx presented evidence demonstrating that momentum in stock prices isn’t an independent anomaly. Instead, it’s driven by fundamental momentum. Marx found that momentum in firm fundamentals (i.e., earnings momentum) explains the performance of strategies based on price momentum. It holds for both large and small stocks. Marx’s findings on fundamental momentum were consistent with the findings of Shuoyuan He and Gans Narayanamoorthy, authors of the September 2017 study “Earnings Acceleration and Stock Returns,” who found that earnings acceleration is a significant predictor of future stock returns—going long in the top decile of quarterly earnings acceleration and short in the bottom decile of earnings acceleration produced large market-adjusted returns.
Based on these findings, at least one investment firm, AQR Capital, has incorporated fundamental momentum as well as price momentum (both cross-sectional and time-series), into their fund construction strategies. As measures of fundamental momentum, AQR uses three fundamental metrics: earnings momentum, analysts’ revisions, and margin growth.
The findings raise an interesting question: Could fundamental momentum exist elsewhere? Because investors underreact to fundamental stock information, perhaps they also underreact to fundamental economic information.
Latest Research
AQR’s Jordan Brooks, Noah Feilbogen, Yao Hua Ooi, and Adam Akant, authors of the February 2024 study “Economic Trend,” examined whether there was a tendency for new information to have a persistent impact on asset prices by positioning in each market based on trends in macroeconomic fundamentals. The authors built on the findings of Jordan Brooks’ original 2017 study “A Half Century of Macro Momentum,” which covered the period 1970-2016. His findings led Brooks to conclude:
“Macro momentum, a systematic approach to global macro investing that takes long positions in assets with improving fundamental trends and short positions in assets with deteriorating fundamental trends, has performed consistently over nearly the last half century. The strategy is highly diversifying to traditional assets, tending to provide an excellent hedge in both large equity market drawdowns and rising real yield environments.”
The authors extended the original strategy described in Brooks’ 2017 paper and focused solely on its directional implementation. To add an out-of-sample test that covered challenging economic times, “the equity market sell-off of 2018, the global pandemic, and the subsequent emergence of global inflation and associated monetary policy response,” they extended the data through 2022. They referred to the “resulting strategy as ‘economic trend,’ an acknowledgment of the similar underlying economic mechanism and attractive performance characteristics it shares with price trend-following.” They began by noting:
“Economic trend and price trend stem from the same premise: asset prices tend to underreact to new information, which, for macro assets, typically takes the form of news about economic fundamentals. In other words, when fundamentals shift, markets adjust gradually. This gradual incorporation of news creates trends in asset prices.” While price trend is a simple strategy, economic trend “requires identifying the relevant fundamental variables that drive each asset’s price (e.g., inflation expectations impact bond prices), modeling trends in these fundamental variables in real-time (e.g., measuring real-time trends in inflation expectations for each market), and a structural mapping from fundamental trends to asset prices (e.g., increasing inflation expectations in a country is bad news for its stock and bond markets, good news for its currency, etc.). Unlike price trend, economic trend will not invest where price action isn’t supported by underlying fundamental news. The strategy will suffer when returns are disconnected from changes in fundamentals (as can happen) but will generate profits when asset prices begin to cue off fundamental news again.”
Methodology
For both growth and inflation, the authors used 12-month changes in GDP growth forecasts and CPI inflation forecasts. For international trade, they used 12-month changes in the local FX spot rate against an export-weighted basket. They measured monetary policy trends using 12-month changes in short-term bond yields. And they measured risk aversion trends using an equal-weighted combination of 12-month trailing equity market returns and 12-month changes in credit spreads.
The authors explained:
“The signs of these relationships are based on theoretically motivated and empirically verified ‘other things equal’ contemporaneous relationships between returns and news about each theme. Economic trend is built on the premise that news tends to have a persistent impact on asset prices, which implies that contemporaneous and predictive relationships between returns and news must have the same sign. This restriction reduces the scope for data mining.” As an example, “Increasing growth is good news for equity markets. Likewise, strong equity market performance is associated with declining inflation, expansionary monetary policy trends, improving trade competitiveness, and declining risk aversion.”
Their asset universe included 15 global equity futures, nine bond futures, seven interest rate futures, eight currency forwards, and 20 commodity futures. For each of the five economic themes, they created a portfolio for each of the four asset classes, leaving us with 20 asset class theme portfolios. The table below shows the signs of each of the relationships:

They then aggregated these asset class theme portfolios into equal risk-weighted composite portfolios, forming three types of composite portfolios:
1) Asset class composite portfolios. These combine all theme views at equal risk weight within a given asset class. For example, the equity asset class composite portfolio invests in equity index futures using growth, inflation, international trade, monetary policy, and risk aversion as inputs.
2) Theme composite portfolios. These trade a single theme across all asset classes. For example, the growth theme composite portfolio invests in equity index futures, bond futures, interest rate futures, currency forwards, and commodity futures, using views based solely on growth.
3) Aggregate economic trend composite portfolio. This is an equal risk-weighted composite across all asset class theme portfolios. It represents the full economic trend strategy, implemented using all themes and assets.
For each asset class, they formed analogous portfolios for price trends, using an equal-weighted combination of one-month, three-month, and 12-month trailing asset returns as factors. The price trend asset class and aggregate composite portfolios used the same universe and portfolio construction described above. All composite portfolios (both economic trend and price trend) targeted 10% constant volatility at each point in time using a trailing three-year covariance matrix.
Following is a summary of their key findings:
- The strategy realized consistently attractive risk-adjusted returns over a 50+-year sample, including the out-of-sample period 2018-2022, and performed well during the stock and bond bear market of 2022.

The results are hypothetical results and are NOT an indicator of future results and do NOT represent returns that any investor actually attained. Indexes are unmanaged and do not reflect management or trading fees, and one cannot invest directly in an index
- The performance was pervasive across both markets and measures.
- Economic trend generated a positive Sharpe ratio in nearly every asset universe (economic trend’s performance was not driven by any one asset class or theme), strong evidence of the pervasiveness of underreactions to changes in economic fundamentals.
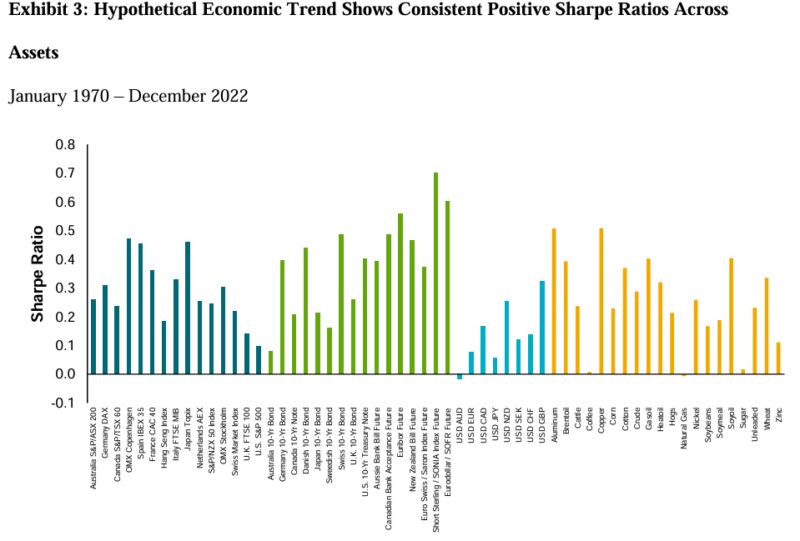
Source: AQR, Bloomberg. Returns are monthly, gross of fees, and transaction costs. Hypothetical data has inherent limitations, some of which are disclosed herein.
The results are hypothetical results and are NOT an indicator of future results and do NOT represent returns that any investor actually attained. Indexes are unmanaged and do not reflect management or trading fees, and one cannot invest directly in an index
- Each standalone asset class and theme portfolio delivered a positive Sharpe ratio, contributing to the overall performance of the composite.

The results are hypothetical results and are NOT an indicator of future results and do NOT represent returns that any investor actually attained. Indexes are unmanaged and do not reflect management or trading fees, and one cannot invest directly in an index.
- The strategy exhibited a low correlation to traditional risk premia on average and tended to perform exceptionally well during drawdown periods for traditional asset classes—large drawdowns usually don’t occur out of the blue but tend to be preceded by changes in economic fundamentals.
- Economic trends performed well in each of the five worst drawdown periods for both U.S. equities and U.S. bonds since 1970.

The results are hypothetical results and are NOT an indicator of future results and do NOT represent returns that any investor actually attained. Indexes are unmanaged and do not reflect management or trading fees, and one cannot invest directly in an index.
- While economic trend is a close relative of price trend-following—both approaches aim to capitalize on the tendency of markets to systematically underreact to news—the two strategies were found to be highly complementary, exhibiting a positive but moderate full-sample correlation between price and economic trend-following strategies (around 0.3 at the asset level and 0.4 for the aggregate composites). Thus, combining the two led to improved risk-adjusted performance and more robust drawdown protection than price trend-following alone.

The results are hypothetical results and are NOT an indicator of future results and do NOT represent returns that any investor actually attained. Indexes are unmanaged and do not reflect management or trading fees, and one cannot invest directly in an index.
- Since price trends tended to perform well in persistent drawdowns, while economic trends tended to perform well in drawdowns that had economic catalysts, the two approaches to trend-following captured a wider variety of market stress scenarios.
- Both price trends and economic trend tended to perform well during drawdowns for traditional asset classes. A diversified blend of the two approaches, however, provided more robust protection.
Their findings led Brooks, Feilbogen, Ooi, and Akant to conclude: “The ability to outperform in a diverse variety of drawdown environments makes price and economic trends a particularly attractive complement to risk mitigation strategies.”
They added:
“By exploiting the same mechanism differently, the economic trend is highly complementary to the price trend. Pairing the two approaches more fully captures the underreaction phenomenon than either approach does standalone, improving both average long-term returns and returns during market stress environments.”
Takeaways
Strong empirical evidence demonstrates that momentum (both cross-sectional and time-series) provides information on the cross-section of returns of many risk assets and has generated alpha relative to existing asset pricing models. Brooks, Feilbogen, Ooi, and Akant’s study adds to that body of research by providing tests of pervasiveness and robustness, increasing our confidence that the findings of momentum in asset prices are not a result of data mining.
They explained:
“Economic trend is a new take on an old classic. As such, it’s grounded in well-established theory, yet constitutes a distinct and innovative approach. The strategy rests on the same premise as price trend – markets tend to incorporate new information gradually – but it captures the phenomenon very differently, using a broad set of real-time measures of economic news. The economic trend backtest shown in this paper uses one simple signal per economic theme (to cover as long a period as possible), comprehensively capturing and processing economic news in real time and extending the set of signals to capture a broader set of economic indicators is a complex and highly ambitious endeavor – one which requires significant investment in data and long-term research.”
The strong empirical evidence is why firms like Alpha Architect, AQR, Avantis, Bridgeway, and Dimensional, leaders in factor investing, incorporate momentum into their strategies. For example, based on research demonstrating the persistence of factor momentum, AQR recently added cross-sectional stock market factor momentum to their general managed futures strategy. Individual investors can utilize momentum strategies without incurring additional costs by incorporating momentum into trading decisions. For example, when rebalancing, they can delay purchases of assets with negative momentum and sales of assets with positive momentum.
Larry Swedroe is head of financial and economic research for Buckingham Wealth Partners, collectively Buckingham Strategic Wealth, LLC and Buckingham Strategic Partners, LLC. The opinions expressed here are their own and may not accurately reflect those of Buckingham Wealth Partners. For information and educational purposes only and should not be construed as specific investment, accounting, legal, or tax advice. Certain information is based on third party data and may become outdated or otherwise superseded without notice. Third-party information is deemed reliable, but its accuracy and completeness cannot be guaranteed. Neither the Securities and Exchange Commission (SEC) nor any other federal or state agency have approved, determined the accuracy, or confirmed the adequacy of this article. LSR-24-637
Disclosure: Alpha Architect
The views and opinions expressed herein are those of the author and do not necessarily reflect the views of Alpha Architect, its affiliates or its employees. Our full disclosures are available here. Definitions of common statistics used in our analysis are available here (towards the bottom).
This site provides NO information on our value ETFs or our momentum ETFs. Please refer to this site.
Disclosure: Interactive Brokers
Information posted on IBKR Campus that is provided by third-parties does NOT constitute a recommendation that you should contract for the services of that third party. Third-party participants who contribute to IBKR Campus are independent of Interactive Brokers and Interactive Brokers does not make any representations or warranties concerning the services offered, their past or future performance, or the accuracy of the information provided by the third party. Past performance is no guarantee of future results.
This material is from Alpha Architect and is being posted with its permission. The views expressed in this material are solely those of the author and/or Alpha Architect and Interactive Brokers is not endorsing or recommending any investment or trading discussed in the material. This material is not and should not be construed as an offer to buy or sell any security. It should not be construed as research or investment advice or a recommendation to buy, sell or hold any security or commodity. This material does not and is not intended to take into account the particular financial conditions, investment objectives or requirements of individual customers. Before acting on this material, you should consider whether it is suitable for your particular circumstances and, as necessary, seek professional advice.
Join The Conversation
If you have a general question, it may already be covered in our FAQs. If you have an account-specific question or concern, please reach out to Client Services.