


![[Gamma] Scalping Please](https://ibkrcampus.com/wp-content/smush-webp/2024/04/tir-featured-8-700x394.jpg.webp "[Gamma] Scalping Please")


Read Part I to get started with the Python packages and datasets.
You can also find the standard deviation and the variance with the “statistics” package. The Python code is shown below:
import statistics as st
print(“Variance of the Closing price is % s”
%(st.variance(tesla[‘Close’])))
print(“Standard Deviation of Closing Price is % s ”
% (st.stdev(tesla[‘Close’])))
The output is as follows:

Univariate graphical method
Let me ask you a question, have you ever asked a friend for directions to their house and felt confused. Sure they are giving the right directions, “Take a left turn at XYZ Mall and a right at the ABC Bank” etc., but you can’t help feeling that it could be better. What if the friend gives you a map and says they have circled the destination in red.”
Well, the map sounds better right? Most of us are quick to learn something if we have a visual in front of us than plain numbers in a table.
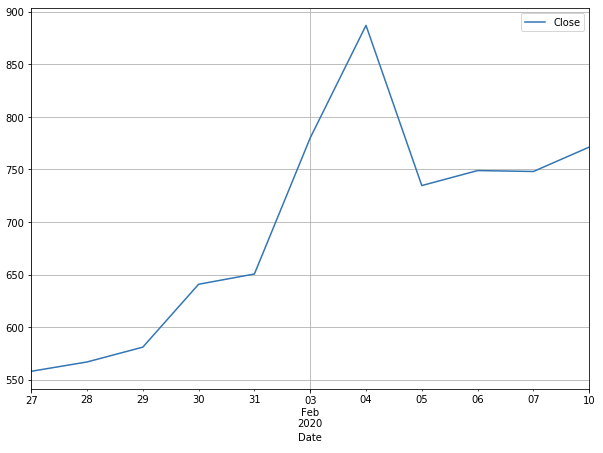
Hence, we will take the earlier example, and do a line plot of the closing price to see the trend in the market.
The Python code is as follows:
import matplotlib.pyplot as plt
tesla[‘Close’].plot(figsize=(10,7))
plt.legend()
plt.grid()
plt.show()
You can also use the histogram to see the distribution. We will find the daily returns and plot its histogram.
Let’s see the histogram:
tesla[‘daily_returns’].dropna()
plt.hist(tesla[‘daily_returns’], bins = 5)
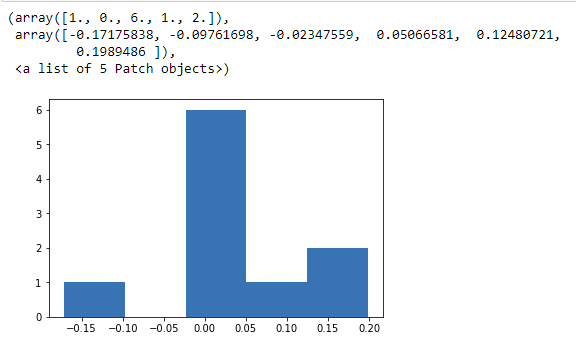
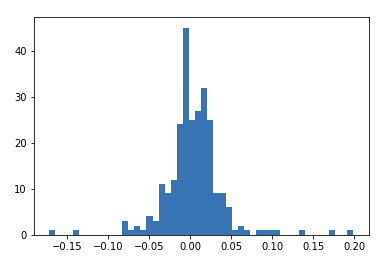
Since it is a small data set, we can’t really infer anything meaningful here. In contrast, if we do a histogram of Tesla for the last year, we will find it as follows:
Visit QuantInsti website to read the full article and download the Python code:
https://blog.quantinsti.com/exploratory-data-analysis-python/
Disclaimer: All investments and trading in the stock market involve risk. Any decisions to place trades in the financial markets, including trading in stock or options or other financial instruments is a personal decision that should only be made after thorough research, including a personal risk and financial assessment and the engagement of professional assistance to the extent you believe necessary. The trading strategies or related information mentioned in this article is for informational purposes only.
Disclosure: Interactive Brokers
Information posted on IBKR Campus that is provided by third-parties does NOT constitute a recommendation that you should contract for the services of that third party. Third-party participants who contribute to IBKR Campus are independent of Interactive Brokers and Interactive Brokers does not make any representations or warranties concerning the services offered, their past or future performance, or the accuracy of the information provided by the third party. Past performance is no guarantee of future results.
This material is from QuantInsti and is being posted with its permission. The views expressed in this material are solely those of the author and/or QuantInsti and Interactive Brokers is not endorsing or recommending any investment or trading discussed in the material. This material is not and should not be construed as an offer to buy or sell any security. It should not be construed as research or investment advice or a recommendation to buy, sell or hold any security or commodity. This material does not and is not intended to take into account the particular financial conditions, investment objectives or requirements of individual customers. Before acting on this material, you should consider whether it is suitable for your particular circumstances and, as necessary, seek professional advice.