


See Part I for an overview.
Key concepts of hierarchical clustering
Let us find the key concepts of hierarchical clustering before moving forward since these will help you with the in-depth learning of hierarchical clustering.
How to identify if two clusters are similar?
One of the ways to do so is to find the distance between clusters.
Measure of distance (similarity)
The distance between two clusters can be computed based on the length of the straight line drawn from one cluster to another. This is commonly known as the Euclidean distance.
The Euclidean distance between two points in either the plane or 3-dimensional space measures the length of a segment connecting the two points. It is the most obvious way of representing distance between two points.
If the (x1,y1) and (x2,y2) are points in 2-dimensional space then the euclidean distance between is:
(x2-x1)2 – (y2-y1)2
Other than Euclidean distance, several other metrics have been developed to measure distance such as:
- Hamming Distance
- Manhattan Distance (Taxicab or City Block)
- Minkowski Distance
The choice of distance metrics should be based on the field of study or the problem that you are trying to solve.
For example, if you are trying to measure the distance between objects on a uniform grid, like a chessboard or city blocks. Then Manhattan distance would be an apt choice.
Linkage Criterion
After selecting a distance metric, it is necessary to determine from where distance is computed. Some of the common linkage methods are:
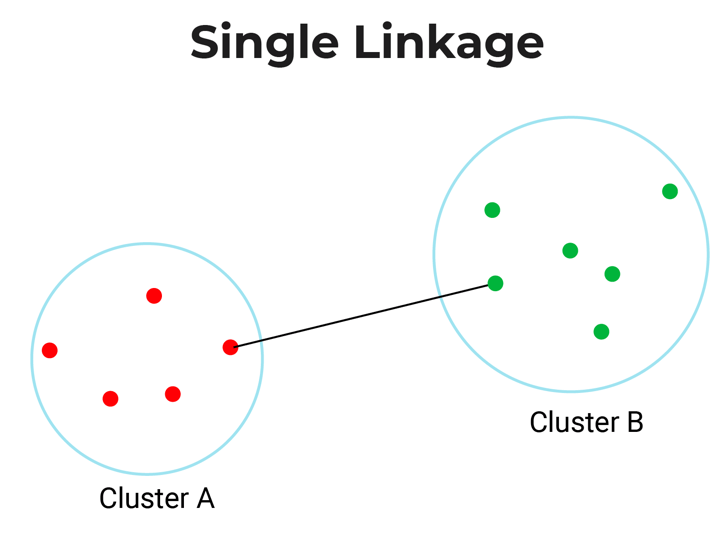
- Single-Linkage: Single linkage or nearest linkage is the shortest distance between a pair of observations in two clusters.
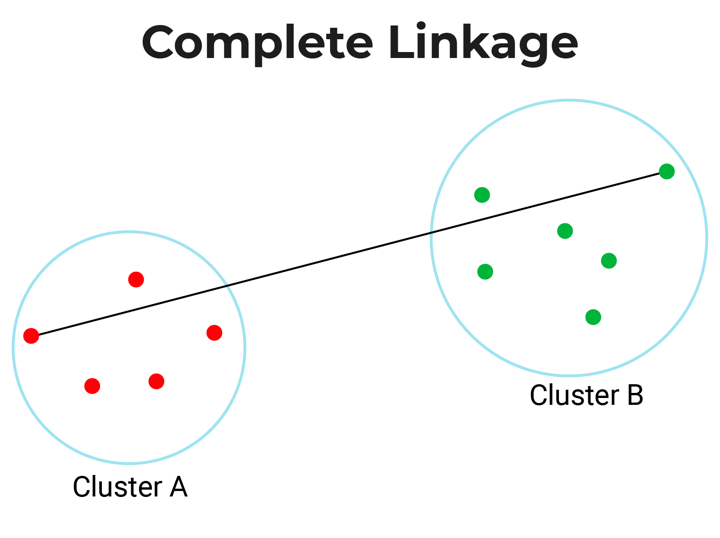
- Complete-linkage: Complete linkage or farthest linkage is the farthest distance between a pair of observations in two clusters.
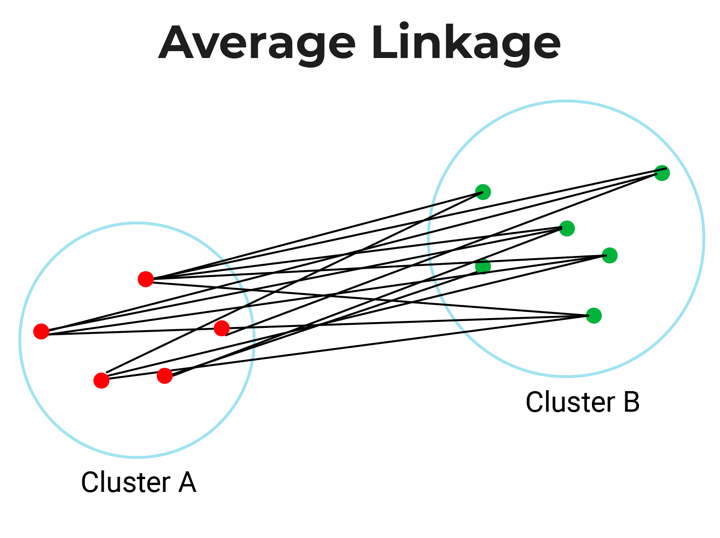
- Average-linkage: Average linkage is the distance between each observation in one cluster to every observation in the other cluster.
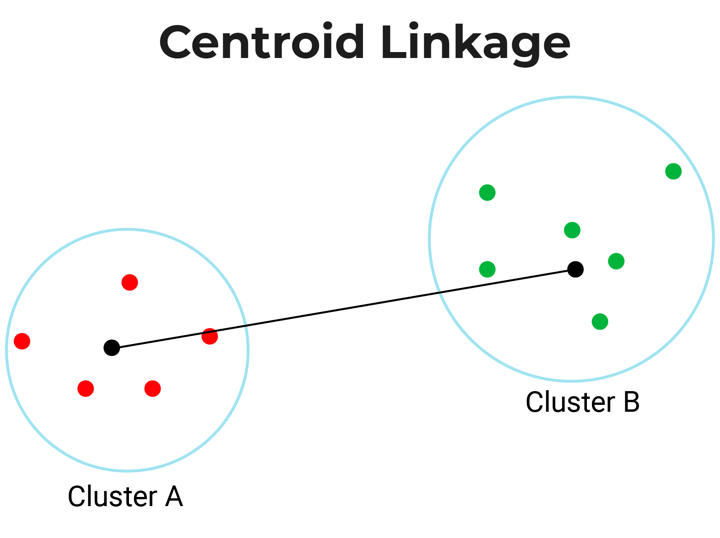
- Centroid-linkage: Centroid linkage is the distance between the centroids of two clusters. In this, you need to find the centroid of two clusters and then calculate the distance between them before merging.
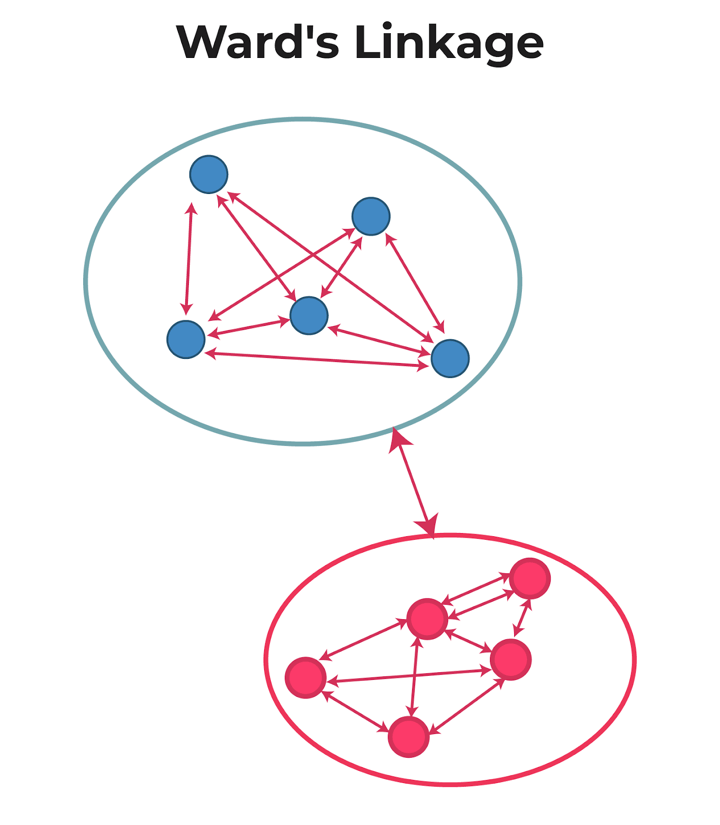
- Ward’s-linkage: Ward’s method or minimum variance method or Ward’s minimum variance clustering method calculates the distance between two clusters as the increase in the error sum of squares after merging two clusters into a single cluster.
In short, ward linkage is the distance which minimises variance in the cluster and maximises variance between the clusters.
The choice of linkage criterion is based on the domain application. Average-linkage and complete-linkage are the two most popular distance metrics in hierarchical clustering.
However, when there are no clear theoretical justifications for the choice of linkage criteria, Ward’s method is the default option.
How to choose the number of clusters?
To choose the number of clusters in hierarchical clustering, we make use of a concept called dendrogram.
What is a Dendrogram?
A dendrogram is a tree-like diagram that shows the hierarchical relationship between the observations. It contains the memory of hierarchical clustering algorithms.
Just by looking at the Dendrogram, you can tell how the cluster is formed. Let’s see how to form the dendrogram for the below data points.
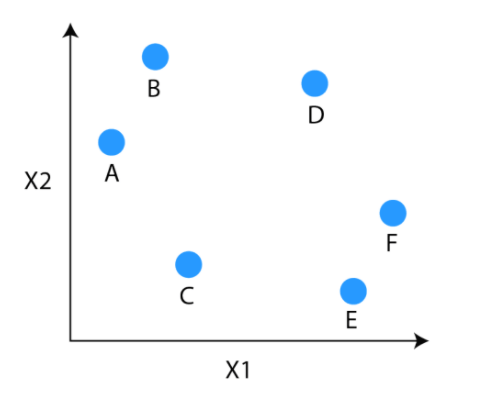
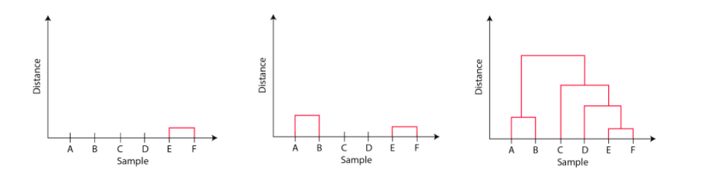
The observations E and F are closest to each other by any other points. So, they are combined into one cluster and also the height of the link that joins them together is the smallest. The next observations that are closest to each other are A and B which are combined together.
This can also be observed in the dendrogram as the height of the block between A and B is slightly bigger than E and F. Similarly, D can be merged into E and F clusters and then C can be combined to that. Finally, A and B combined to C, D, E and F to form a single cluster.
The important point to note while reading the dendrogram is that:
- The Height of the blocks represents the distance between clusters, and
- Distance between observations represents dissimilarities.
But the question still remains the same, how do we find the number of clusters using a dendrogram or where should we stop merging the clusters? Observations are allocated to clusters by drawing a horizontal line through the dendrogram.
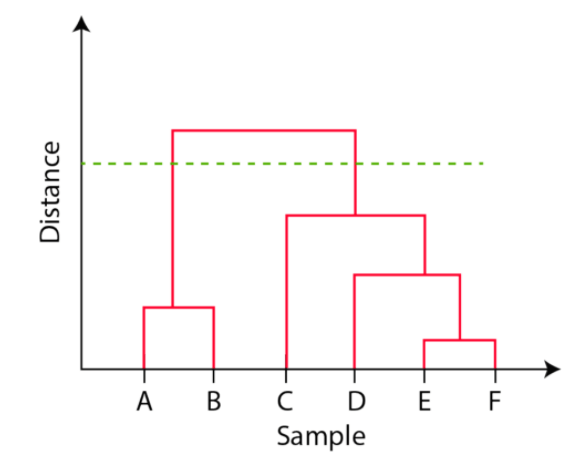
Generally, we cut the dendrogram in such a way that it cuts the tallest vertical line. In the above example, we have two clusters. One cluster has observations A and B, and a second cluster has C, D, E, and F.
Stay tuned for Part III.
Originally posted on QuantInsti blog.
Disclosure: Interactive Brokers
Information posted on IBKR Campus that is provided by third-parties does NOT constitute a recommendation that you should contract for the services of that third party. Third-party participants who contribute to IBKR Campus are independent of Interactive Brokers and Interactive Brokers does not make any representations or warranties concerning the services offered, their past or future performance, or the accuracy of the information provided by the third party. Past performance is no guarantee of future results.
This material is from QuantInsti and is being posted with its permission. The views expressed in this material are solely those of the author and/or QuantInsti and Interactive Brokers is not endorsing or recommending any investment or trading discussed in the material. This material is not and should not be construed as an offer to buy or sell any security. It should not be construed as research or investment advice or a recommendation to buy, sell or hold any security or commodity. This material does not and is not intended to take into account the particular financial conditions, investment objectives or requirements of individual customers. Before acting on this material, you should consider whether it is suitable for your particular circumstances and, as necessary, seek professional advice.
Join The Conversation
If you have a general question, it may already be covered in our FAQs. If you have an account-specific question or concern, please reach out to Client Services.