


Learn how to get historical data for stocks with Part I in this tutorial.
S&P 500 Stock Tickers
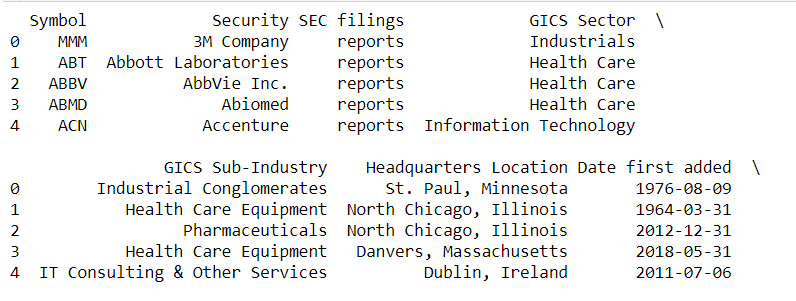
If you want to analyse the stock market data for all the stocks which make up S&P 500 then below code will help you. It gets the list of stocks from the Wikipedia page and then fetches the stock market data from yahoo finance.
# Import packages
import yfinance as yf
import pandas as pd
# Read and print the stock tickers that make up S&P500
tickers = pd.read_html(
'https://en.wikipedia.org/wiki/List_of_S%26P_500_companies')[0]
print(tickers.head())
# Get the data for this tickers from yahoo finance
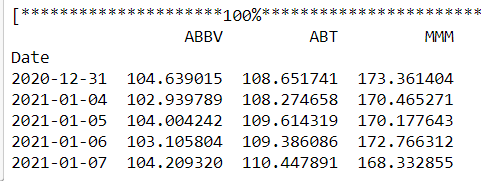
data = yf.download(tickers.Symbol.to_list(),'2021-1-1','2021-7-12', auto_adjust=True)['Close']
print(data.head())
SP500_tickers_data.py hosted with ❤ by GitHub
Intraday or Minute Frequency Stock Data
yfinance module can be used to fetch the minute level stock market data. It returns the stock market data for the last 7 days.
If yfinance is not installed on your computer, then run the below line of code from your Jupyter Notebook to install yfinance.
!pip install yfinance
install yfinance.py hosted with ❤ by GitHub
The yfinance module has the download method which can be used to download the stock market data.
It takes the following parameters:
ticker: The name of the tickers you want the stock market data for. If you want stock market data for multiple tickers then separate them by spaceperiod: The number of days/month of stock market data required. The valid frequencies are 1d, 5d, 1mo, 3mo, 6mo, 1y, 2y, 5y, 10y, ytd, maxinterval: The frequency of the stock market data. The valid intervals are 1m, 2m, 5m, 15m, 30m, 60m, 90m, 1h, 1d, 5d, 1wk, 1mo, 3mo
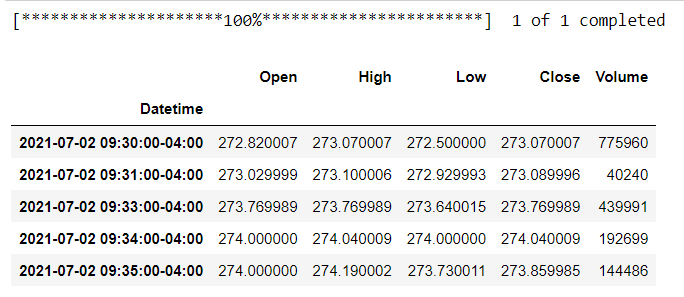
The below code fetches the stock market data for MSFT for the past 5 days of 1-minute frequency.
import yfinance as yf
intraday_data = yf.download(tickers="MSFT",
                            period="5d",
                            interval="1m",
                            auto_adjust=True)
intraday_data.head()
minute_data.py hosted with ❤ by GitHub
Resample Stock Data
Convert 1-minute data to 1-hour data or Resample Stock Data
During strategy modelling, you might be required to work with a custom frequency of stock market data such as 15 minutes or 1 hour or even 1 month.
If you have minute level data, then you can easily construct the 15 minutes, 1 hour or daily candles by resampling them. Thus, you don’t have to buy them separately.
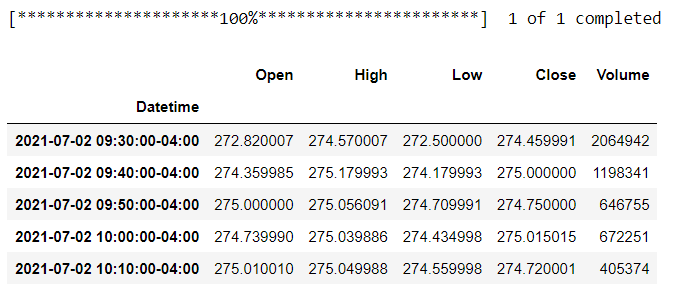
In this case, you can use the pandas resample method to convert the stock market data to the frequency of your choice. The implementation of these is shown below where a 1-minute frequency data is converted to 10-minute frequency data.
The first step is to define the dictionary with the conversion logic. For example, to get the open value the first value will be used, to get the high value the maximum value will be used and so on.
The name Open, High, Low, Close and Volume should match the column names in your dataframe.
ohlcv_dict = {
 'Open': 'first',
 'High': 'max',
 'Low': 'min',
 'Close': 'last',
 'Volume': 'sum'
}
ohlcv_dict.py hosted with ❤ by GitHub
Convert the index to datetime timestamp as by default string is returned. Then call the resample method with the frequency such as:
- 10T for 10 minutes,
- D for 1 day and
- M for 1 month
# Import package & get the data
import yfinance as yf
intraday_data = yf.download(tickers="MSFT",
                            period="5d",
                            interval="1m",
                            auto_adjust=True)

# Define the resampling logic
ohlcv_dict = {
     'Open': 'first',
     'High': 'max',
     'Low': 'min',
     'Close': 'last',
     'Volume': 'sum'
}

# Resample the data
intraday_data_10 = intraday_data.resample('10T').agg(ohlcv_dict)
intraday_data_10.head()
resample_data_10.py hosted with ❤ by GitHub
Yahoo finance has limited set of minute level data. if you need the stock market data for higher range then you can get the data from data vendors such as Quandl, AlgoSeek or your broker.
Using Quandl to get Stock Market Data (Optional)
Quandl has many data sources to get different types of stock market data. However, some are free and some are paid. Wiki is the free data source of Quandl to get the data of the end of the day prices of 3000+ US equities. It is curated by Quandl community and also provides information about the dividends and split.
Quandl also provides paid data source of minute and lower frequencies.
To get the stock market data, you need to first install the quandl module if it is not already installed using the pip command as shown below.
!pip install quandl
Install quandl.py hosted with ❤ by GitHub
You need to get your own API Key from quandl to get the stock market data using the below code. If you are facing issue in getting the API key then you can refer to this link.
After you get your key, assign the variable QUANDL_API_KEY with that key. Then set the start date, end date and the ticker of the asset whose stock market data you want to fetch.
The quandl get method takes this stock market data as input and returns the open, high, low, close, volume, adjusted values and other information.
# Import quandl package
import quandl

# To get your API key, sign up for a free Quandl account.
# Then, you can find your API key on Quandl account settings page.
QUANDL_API_KEY = 'REPLACE-THIS-TEXT-WITH-A-REAL-API-KEY'

# This is to prompt you to change the Quandl Key
if QUANDL_API_KEY == 'REPLACE-THIS-TEXT-WITH-A-REAL-API-KEY':
    raise Exception("Please provide a valid Quandl API key!")

# Set the start and end date
start_date = '1990-01-01'
end_date = '2018-03-01'

# Set the ticker name
ticker = 'AMZN'

# Feth the data
data = quandl.get('WIKI/'+ticker,
                  start_date=start_date,
                  end_date=end_date,
                  api_key=QUANDL_API_KEY)

# Print the first 5 rows of the dataframe
data.head()
get_data_quandl.py hosted with ❤ by GitHub
| Date | Open | High | Low | Close | Volume | Ex-Dividend | Split Ratio | Adj. Open | Adj. High | Adj. Low | Adj. Close | Adj. Volume |
|---|---|---|---|---|---|---|---|---|---|---|---|---|
| 1997-05-16 | 22.38 | 23.75 | 20.50 | 20.75 | 1225000.0 | 0.0 | 1.0 | 1.865000 | 1.979167 | 1.708333 | 1.729167 | 14700000.0 |
| 1997-05-19 | 20.50 | 21.25 | 19.50 | 20.50 | 508900.0 | 0.0 | 1.0 | 1.708333 | 1.770833 | 1.625000 | 1.708333 | 6106800.0 |
| 1997-05-20 | 20.75 | 21.00 | 19.63 | 19.63 | 455600.0 | 0.0 | 1.0 | 1.729167 | 1.750000 | 1.635833 | 1.635833 | 5467200.0 |
| 1997-05-21 | 19.25 | 19.75 | 16.50 | 17.13 | 1571100.0 | 0.0 | 1.0 | 1.604167 | 1.645833 | 1.375000 | 1.427500 | 18853200.0 |
| 1997-05-22 | 17.25 | 17.38 | 15.75 | 16.75 | 981400.0 | 0.0 | 1.0 | 1.437500 | 1.448333 | 1.312500 | 1.395833 | 11776800.0 |
Stay tuned for the next installment for insights on getting Fundamental Data.
Originally posted on QuantInsti blog.
Disclosure: Interactive Brokers
Information posted on IBKR Campus that is provided by third-parties does NOT constitute a recommendation that you should contract for the services of that third party. Third-party participants who contribute to IBKR Campus are independent of Interactive Brokers and Interactive Brokers does not make any representations or warranties concerning the services offered, their past or future performance, or the accuracy of the information provided by the third party. Past performance is no guarantee of future results.
This material is from QuantInsti and is being posted with its permission. The views expressed in this material are solely those of the author and/or QuantInsti and Interactive Brokers is not endorsing or recommending any investment or trading discussed in the material. This material is not and should not be construed as an offer to buy or sell any security. It should not be construed as research or investment advice or a recommendation to buy, sell or hold any security or commodity. This material does not and is not intended to take into account the particular financial conditions, investment objectives or requirements of individual customers. Before acting on this material, you should consider whether it is suitable for your particular circumstances and, as necessary, seek professional advice.
Join The Conversation
If you have a general question, it may already be covered in our FAQs. If you have an account-specific question or concern, please reach out to Client Services.