

")


Allow me to propose a game show scenario. Seven companies spend several months in a secluded mansion, pampered, feted, and largely impervious to events that go on outside their cloister. Real-world events are tense, but not for those in the chateau. Then, each has to make a presentation to a faceless set of global voters, all of whom anonymously vote whether the company gets to remain in the club. It doesn’t sound like a particularly scintillating show, but it is an all-too nerve-wracking reality for those trading the “Magnificent Seven” stocks.
Markets, of course, are never as clear-cut as a reality TV show. Over the past few days, yesterday and Monday, in particular, we have wondered what the consequences might be if the “Magnificent Seven” was whittled down to a “Big Five” or “Fantastic Four.” It is an important consideration after the adverse reactions to Tesla (TSLA) and Alphabet (GOOG, GOOGL) earnings over recent days. It is far too early to know with any certainty whether either of those companies has been booted off the proverbial island, though. Given the unique mindshare that TSLA occupies (it is typically by far the most actively traded stock on the IBKR platform) and GOOGL’s enormous power in search related advertising, it is highly unlikely that investors have completely soured on either company. The key for investors is whether these companies and their mega-cap tech peers can maintain their valuation premia and outperformance.
The latest disappointment came yesterday from Meta Platforms (META). This is a case of a stock beating its published expectations but offering poor guidance during its conference call. The stock fell about 4% yesterday on pre-earnings jitters as the broader market sank, then rallied 5% after the number, only to fall over 5% shortly after the call. Yesterday we highlighted the stock’s propensity for double-digit percentage post-earnings moves. We haven’t seen one on a close-to-close basis – the stock is down -4% as I write this – but a 10% head fake in the course of a couple of hours is indeed noteworthy.
Now we look ahead to Amazon (AMZN) earnings after today’s close. The stock fell over -5.5% yesterday after the market decided to focus on GOOGL’s miss in cloud computing rather than Microsoft’s (MSFT). After this week’s volatility, options traders are pricing in adequate, if not risk-averse, levels of implied volatility for at-money options expiring tomorrow. We see 10.5% daily volatility, which is above the 6-month average of 8.65% (+8.27%, -3.98%, -8.43%, -6.8%, +10.36%, -14.05%):
AMZN – Volatility Term Structure, Expressed in Daily Percentage Terms
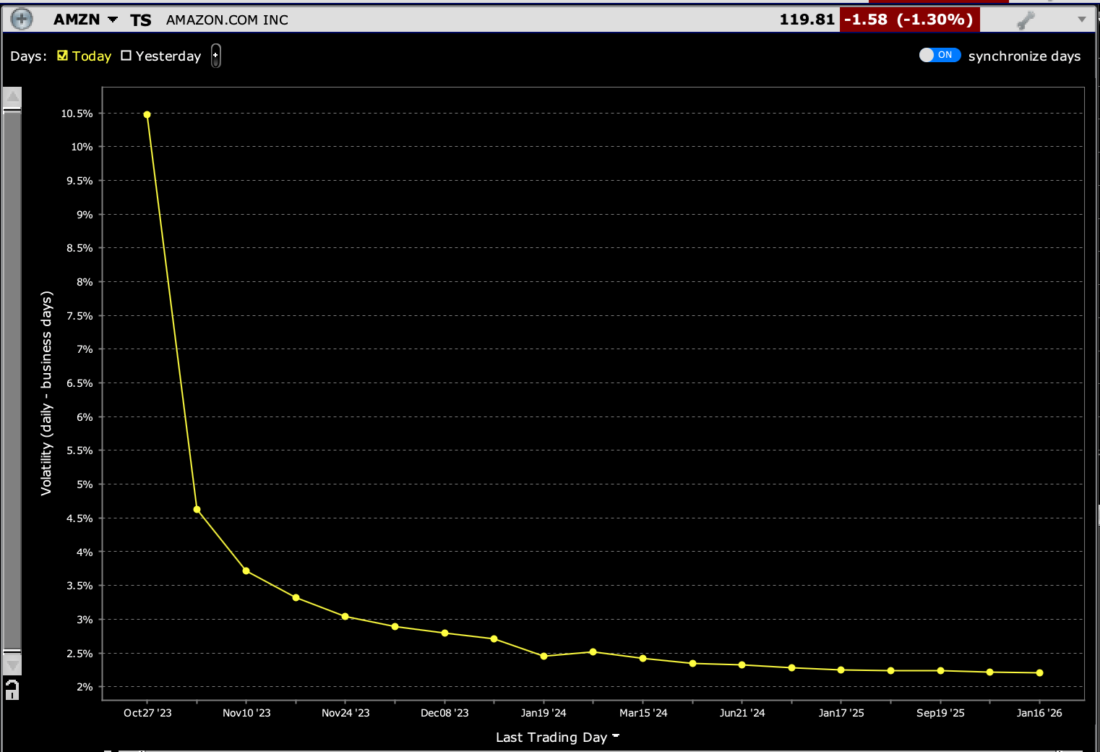
Source: Interactive Brokers
Meanwhile, the IBKR Probability Lab shows modest risk aversion. The peak probability is in the $114-$116 range, which is about -3.5% below the current $119 level:
IBKR Probability Lab for AMZN Options Expiring October 27th
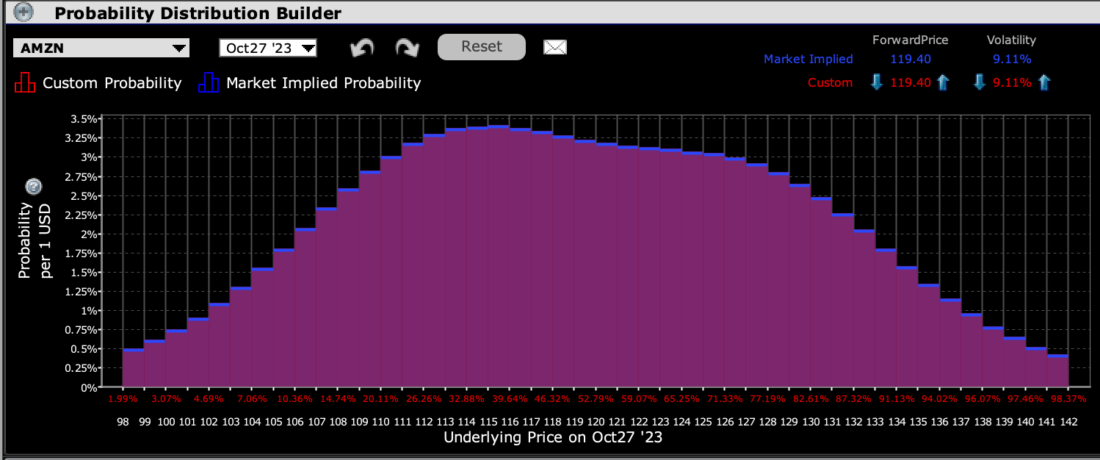
Source: Interactive Brokers
The skew is a bit snake-like, with a notable bump in at-money implied volatilities for this Friday’s options rather than the more typical asymmetrical “Elvis smile.”
AMZN: Skew for Options Expiring October 27th (green), November 3rd (blue), November 17th (yellow)
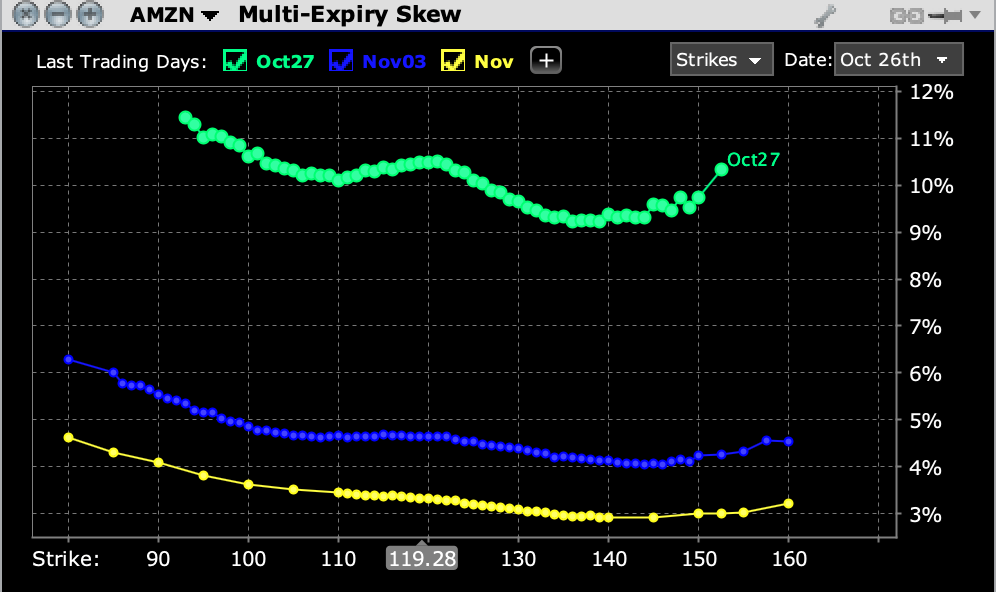
Source: Interactive Brokers
Let’s face it – this has been a harrowing week for many tech-heavy portfolios. We still see the Cboe Volatility Index (VIX) at levels that typically don’t indicate panicky levels of demand for volatility protection from institutions. That said, we now see some fairly pronounced backwardation in the VIX futures curve, which indicates excess demand for short-term volatility. Last week we wrote about the significance of an inverted VIX futures curve. The situation rectified itself earlier this week but has reappeared today.
Traders are wary, and if they’ve lost their last safe haven (the Magnificent Seven), the tone of the market over the coming weeks will likely reflect that wariness.
VIX Futures Term Structure, Today (green), Yesterday (orange), Last Week (blue)
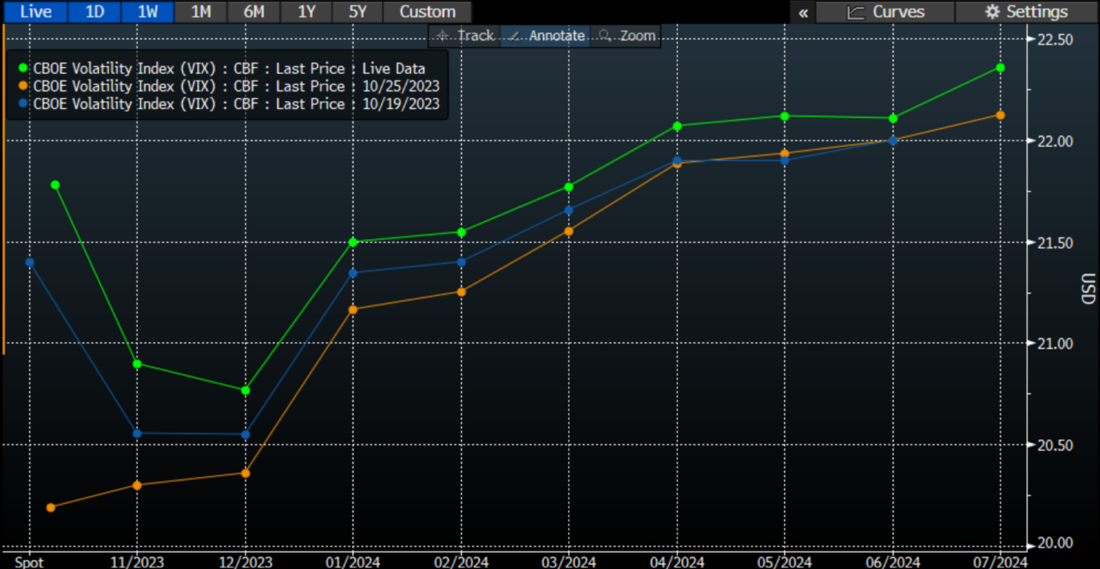
Source: Bloomberg
Disclosure: Interactive Brokers
The analysis in this material is provided for information only and is not and should not be construed as an offer to sell or the solicitation of an offer to buy any security. To the extent that this material discusses general market activity, industry or sector trends or other broad-based economic or political conditions, it should not be construed as research or investment advice. To the extent that it includes references to specific securities, commodities, currencies, or other instruments, those references do not constitute a recommendation by IBKR to buy, sell or hold such investments. This material does not and is not intended to take into account the particular financial conditions, investment objectives or requirements of individual customers. Before acting on this material, you should consider whether it is suitable for your particular circumstances and, as necessary, seek professional advice.
The views and opinions expressed herein are those of the author and do not necessarily reflect the views of Interactive Brokers, its affiliates, or its employees.
Disclosure: Probability Lab
The projections or other information generated by the Probability Lab tool regarding the likelihood of various investment outcomes are hypothetical in nature, do not reflect actual investment results and are not guarantees of future results. Please note that results may vary with use of the tool over time.
Disclosure: Options Trading
Options involve risk and are not suitable for all investors. Multiple leg strategies, including spreads, will incur multiple commission charges. For more information read the "Characteristics and Risks of Standardized Options" also known as the options disclosure document (ODD) or visit ibkr.com/occ


Join The Conversation
If you have a general question, it may already be covered in our FAQs. If you have an account-specific question or concern, please reach out to Client Services.