


Fortunately for investors, the US equity market has been broadening its focus beyond the “Magnificent Seven”. That said, their importance to market capitalization indices remains quite significant. After today’s close, we learn about second quarter earnings from Microsoft (MSFT) and Alphabet (GOOG, GOOGL). Not only are they 2/7, or 28.5% of the Magnificent Seven, but their combined weights in the NASDAQ 100 (NDX) and S&P 500 (SPX) indices are 20% and 10% respectively. Whether or not you have a position in either of those specific companies, even passive index investors have significant exposures to them.
Although Google is by far the number one search engine, way ahead of if closest competitor, MSFT’s Bing, its parent company Alphabet is “only” about 60% the size of MSFT. Hey, this piece is being typed on MS Office on a Windows PC, so its clear that MSFT has other businesses to rely on. Granted, we’re talking about $1.5 trillion and $2.6 trillion companies – both behemoths by any standard – but it seems prudent that we should start with MSFT.
Analyst consensus for MSFT Earnings per Share (EPS) is $2.55. That compares with $2.45 last quarter and $2.23 last year. The company sports a trailing P/E ratio of 37 and a forward P/E of 36, meaning that expectations for growth are not particularly robust. This is evident in the company’s estimated PEG ratio of 2.33. It’s nowhere near as aggressively valued as we noted ahead of last week’s Tesla earnings, but it is hardly cheap by conventional valuation metrics.
Over a long-term, MSFT’s average post-earnings move has been 3.74%, but four of the last five moves have been above that average: +7.2%, -0.6%, -7.7%, +6.7% and 4.8%. Consequently, it is not surprising to see the options market pricing in a larger-than-average move of about 5%:
Volatility Term Structure for MSFT Options
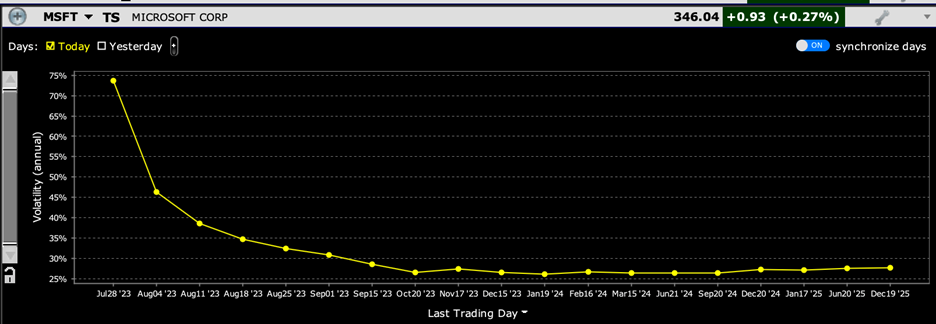
Source: Interactive Brokers
As with TSLA, we see a seemingly contradictory approach to the post-earnings move in MSFT. The peak level shown by the IBKR Probability Lab is in the $338-$340 range, a roughly 2% drop from its current level:
IBKR Probability Lab for MSFT Options Expiring July 28, 2023
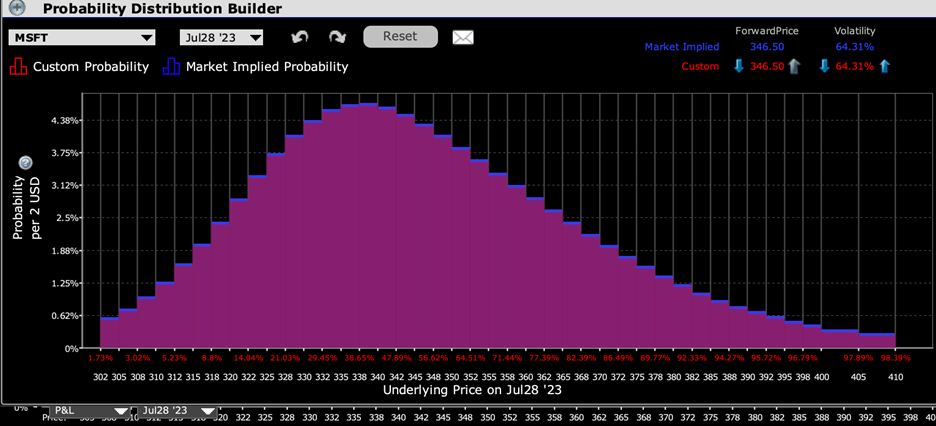
Source: Interactive Brokers
But meanwhile, a graph of options skew shows minimum implied volatilities about 7.5% below the current level and aggressive prices being paid for out of the money calls. This is similar to what we saw ahead of TSLA’s 10% drop last week, by the way.
Skew for MSFT Options Expiring July 28th (dark blue), August 4th (light blue) and August 18th (yellow)
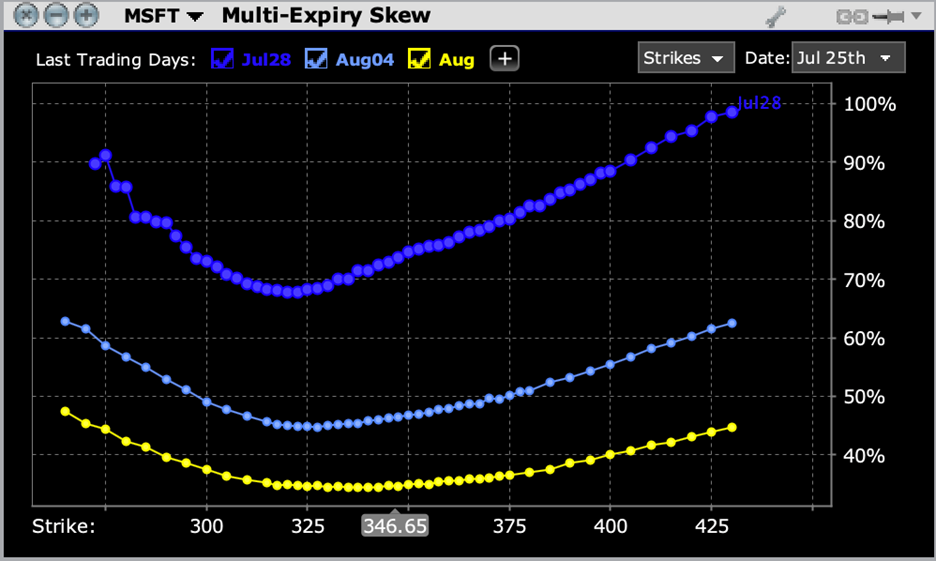
Source: Interactive Brokers
The pictures in GOOG are not all that different from MSFT, though the probability is centered more around at-money options:
IBKR Probability Lab for GOOG Options Expiring July 28, 2023
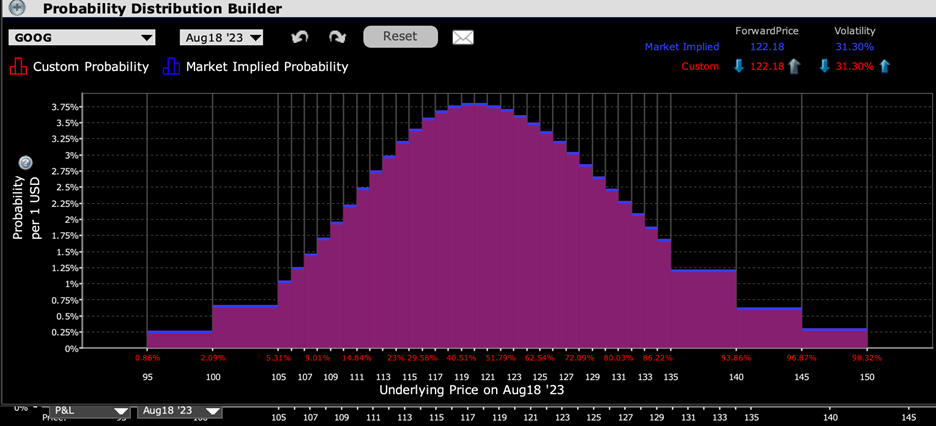
Source: Interactive Brokers
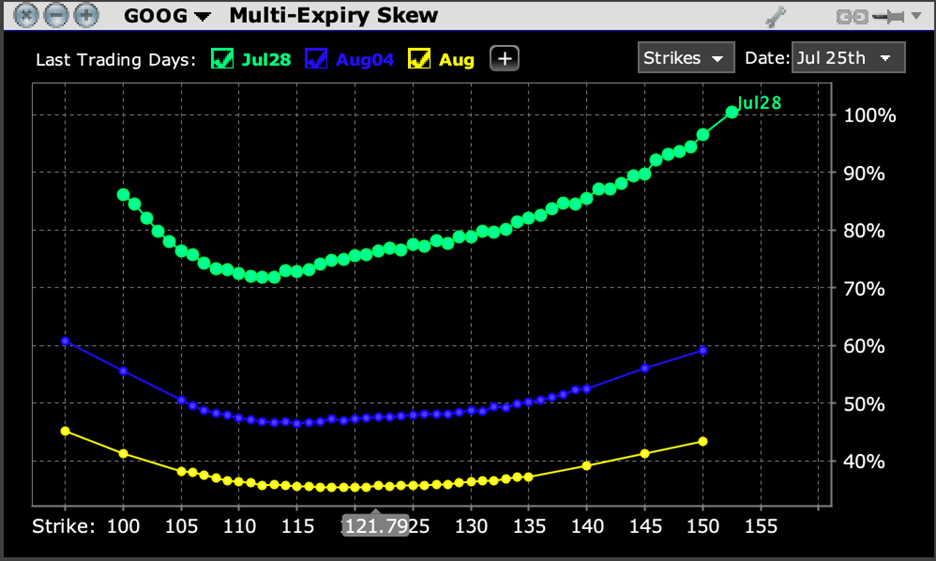
The skews, on the other hand, are quite similar to MSFT’s, with a dip about 7% below the current GOOG stock price and with aggressive pricing in above market calls:
Skew for GOOG Options Expiring July 28th (dark blue), August 4th (light blue) and August 18th (yellow)
Source: Interactive Brokers
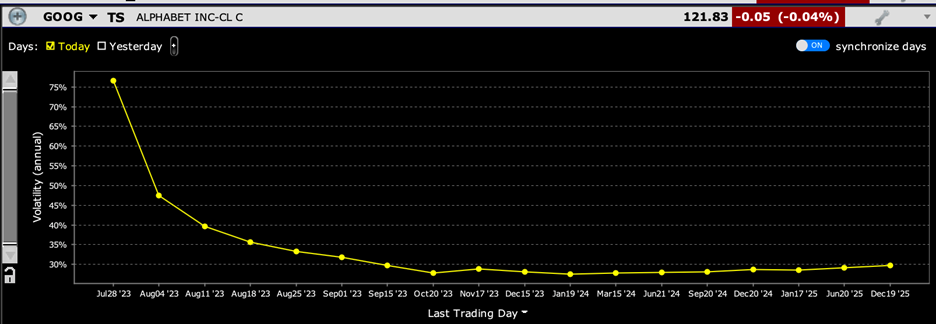
The implied volatility term structure for GOOG is also quite similar to MSFT’s. Here too, options traders are pricing in a roughly 5% move, which is slightly above GOOG’s long-term average 4.6% move. The last couple of reactions have been well below average, at -0.13% and +2.75% respectively, though the prior two moves of -9.1% and +7.7% were indeed substantial.
Volatility Term Structure for GOOG Options
Source: Interactive Brokers
Expectations for GOOG’s EPS are a consensus $1.44, above last quarter’s $1.17 and last year’s $1.21. The stock is priced less aggressively than MSFT’s, with GOOG sporting a trailing P/E of 25, a forward P/E of 23, and a quite manageable estimated PEG ratio of 1.36. These numbers are much more in line with the S&P overall.
If there is a pattern to earnings season so far, it is that the post-earnings reaction is generally inversely proportional to the stock’s recent performance. Yesterday we wrote:
Although it is still too early in this earnings season to draw definitive conclusions, my early hypothesis is that better performing stocks have higher earnings day hurdles than relative underperformers. We wrote about this on Thursday, when high-flying Tesla (TSLA), Netflix (NFLX) and Taiwan Semiconductor (TSM) all beat their consensus expectations for earnings per share (EPS) but fell sharply nonetheless when investors focused on the totality of their reports. Meanwhile, Goldman Sachs (GS) missed its number and has rallied ever since, and Zion’s Bancorp (ZION) rose 10% after a 2 cent beat. If this pattern holds, it raises the stakes for the remaining mega-cap tech companies that have powered major US indices.
Considering that MSFT and GOOG are up 45% and 37.5% respectively on a year-to-date basis, it is reasonable to think that there is potential for disappointment – even if the EPS results beat expectations. In MSFT’s case, investors will be paying close attention to enterprise spending, particularly on cloud computing. Remember, MSFT hosts ChatGPT. In GOOG’s case, cloud computing plays a role too, though it will likely be secondary to trends in search-related advertising. We can also see how much both companies lean into AI-fever, especially if the reports shed light on whether artificial intelligence is currently a profit center or an expense.
Join The Conversation
If you have a general question, it may already be covered in our FAQs. If you have an account-specific question or concern, please reach out to Client Services.
Leave a Reply
Disclosure: Interactive Brokers
The analysis in this material is provided for information only and is not and should not be construed as an offer to sell or the solicitation of an offer to buy any security. To the extent that this material discusses general market activity, industry or sector trends or other broad-based economic or political conditions, it should not be construed as research or investment advice. To the extent that it includes references to specific securities, commodities, currencies, or other instruments, those references do not constitute a recommendation by IBKR to buy, sell or hold such investments. This material does not and is not intended to take into account the particular financial conditions, investment objectives or requirements of individual customers. Before acting on this material, you should consider whether it is suitable for your particular circumstances and, as necessary, seek professional advice.
The views and opinions expressed herein are those of the author and do not necessarily reflect the views of Interactive Brokers, its affiliates, or its employees.
Disclosure: Probability Lab
The projections or other information generated by the Probability Lab tool regarding the likelihood of various investment outcomes are hypothetical in nature, do not reflect actual investment results and are not guarantees of future results. Please note that results may vary with use of the tool over time.
Disclosure: Options Trading
Options involve risk and are not suitable for all investors. Multiple leg strategies, including spreads, will incur multiple commission charges. For more information read the "Characteristics and Risks of Standardized Options" also known as the options disclosure document (ODD) or visit ibkr.com/occ


Microsoft’s market cap is bigger than the entire Russell 2000, which is still trading at a ridiculously low price relative to the S&P 500. When the SPY reached $480 in 2021 the IWM reached $240. Historically, the IWM price trades more or less at 50% of the SPY price, so currently it is 40%, which is the biggest divergence I could find going back to 2003.
I would rather buy the Russell 2000 now than any of the mega cap techs.
It’s hard to believe that companies like Microsoft with battleship financials would have long term volatility issues that investors would even care about. I also can’t imagine this being a short sellers opportunity. Just my 2c…