


")


The article “Estimating Stocks-Bonds Correlation from Long-Term Data” first appeared on Quantpedia.
Excerpt
There are a few concepts in the world of finance that are taken for granted, and one of them is the free lunch of diversification. Investors like to mix stocks and bonds into a simple allocation portfolio and hope for better outcomes than investing in just one asset. But the favorable return-to-risk profile of those asset allocation strategies relies on the low correlation between those two asset classes, which, as we will see from today’s contribution, we can’t take for granted. We hope the recent study sheds more light on this topic.
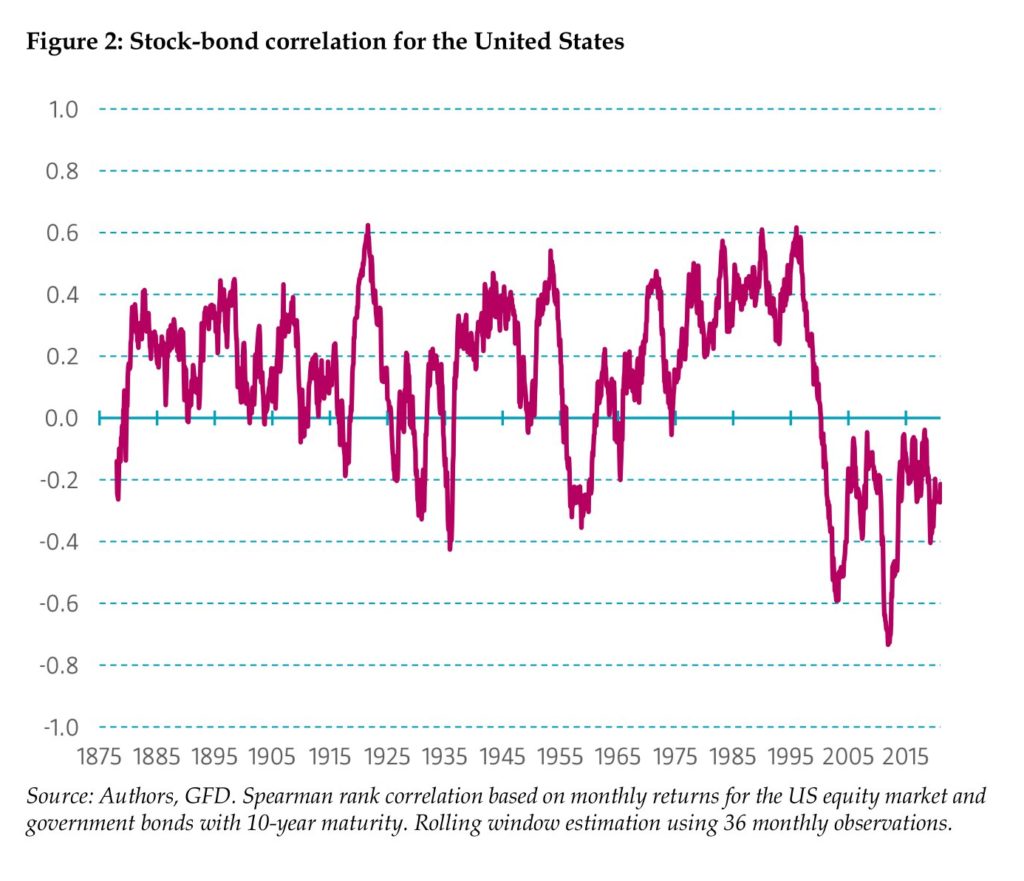
Molenaar, Senechal, Swinkels, and Wang (Jul 2023) examine the empirical relationship between stock and bond returns, using deep historical data from 1875 with various monetary regimes for various countries. Over the whole sample, the positive stock-bond correlation has been more common than a negative one, even though the latter has been observed mainly in the past two decades.
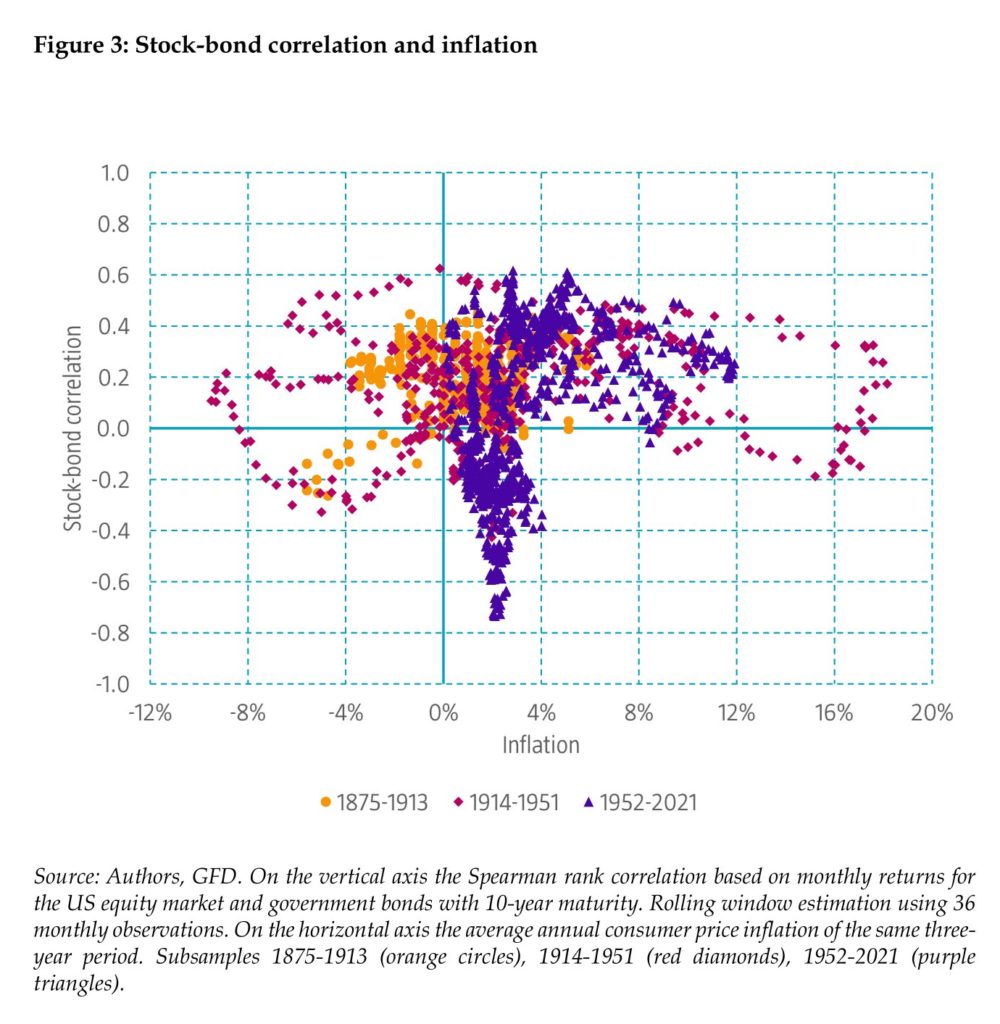
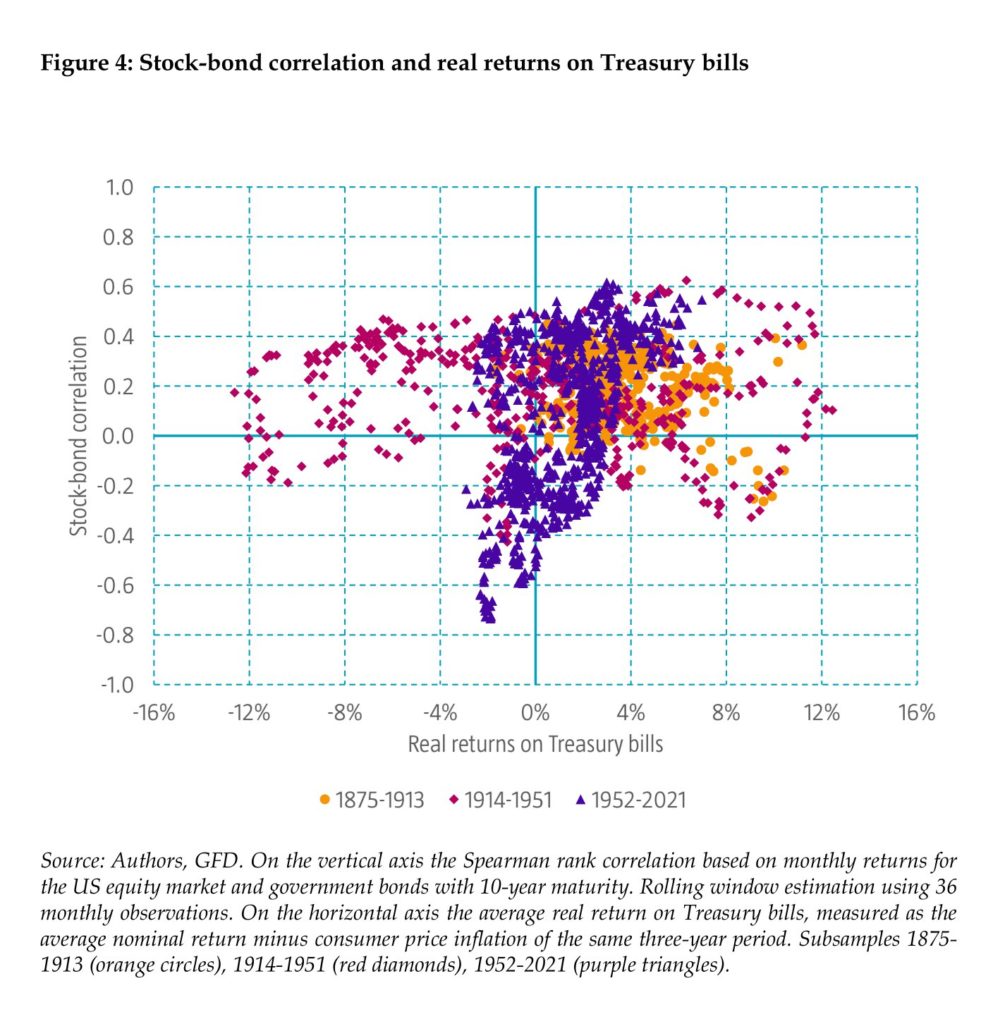
From the 60s, with independent central banks, a positive stock-bond correlation is observed during periods with (normally) high inflation and high actual returns on Treasury bills. Bond risk premiums derived from the term structure of interest rates are positively related to those based on the CAPM (Capital Asset Pricing Model) and, therefore, derived from the stock-bond correlation. This may indicate that the CAPM has a more robust empirical basis than within asset classes.
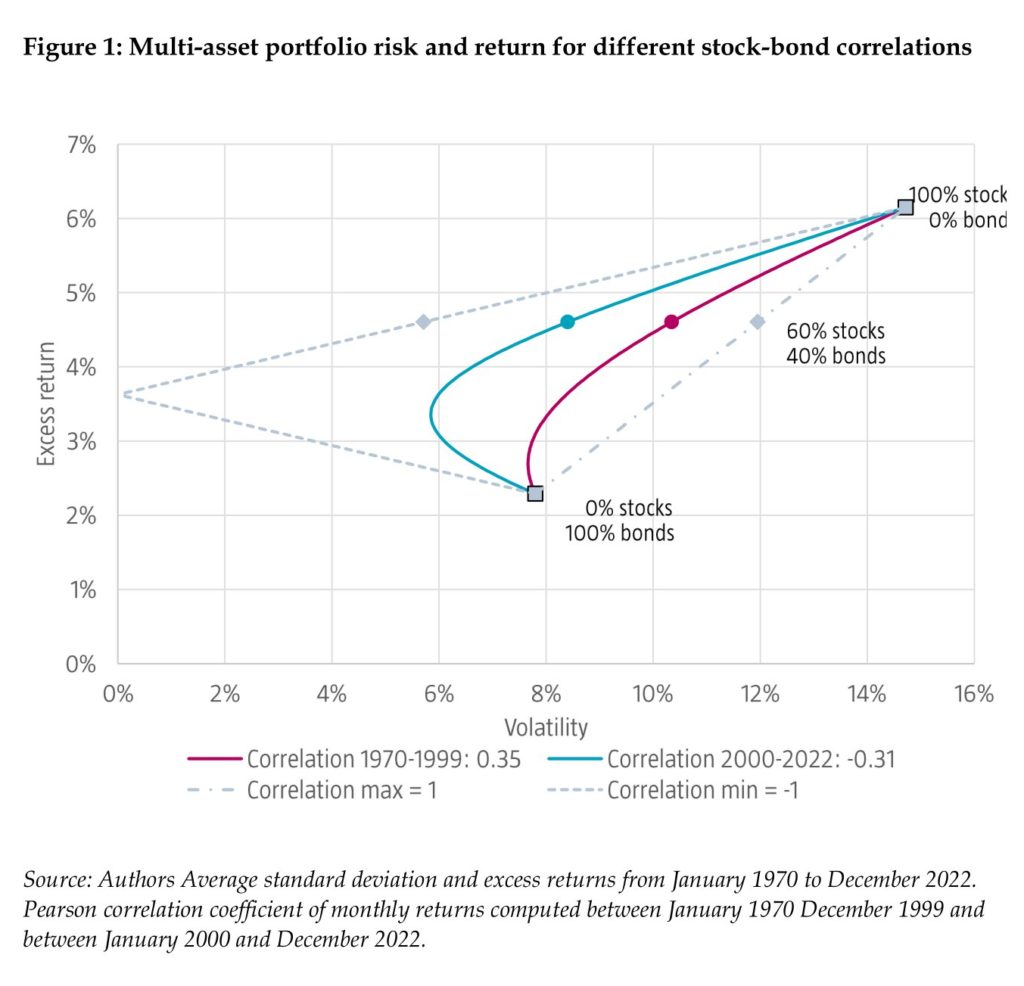
From the rich selection of clear pictures, we would like to point out Figure 1, which – keeping equity and bond mean returns and volatilities constant at the total sample values – shows that the correlation until the millennium leads to a volatility of 10.4% per annum for the 60/40 portfolio, whereas this reduces to 8.5% with the correlation realized in the post-1999 period.
These findings have important implications for multi-asset investors. Historical regimes with positive stock-bond correlation are associated with higher volatility risk of a 60/40 portfolio and lower Sharpe ratios. Changes in inflation and the actual return on Treasury bills could, through their effect on the stock-bond correlation, materially impact the risk of multi-asset portfolios and the risk premiums that investors can earn during those periods.
Authors: Roderick Molenaar, Edouard Senechal, Laurens Swinkels, Zhenping Wang
Title: Empirical evidence on the stock-bond correlation
Link: https://papers.ssrn.com/sol3/papers.cfm?abstract_id=4514947
Abstract:
The correlation between stock and bond returns is a cornerstone of asset allocation decisions. The correlation can move considerably over time, which can have a large impact on portfolio construction. Our empirical evidence points to inflation and real returns on short-term bonds, and the uncertainty surrounding inflation as important factors for understanding the sign and magnitude of the stock-bond correlation. Our historical analyses across countries suggest that our findings are robust. We apply these insights to analyze the implications of a shift in stock-bond correlation regime for the risk of multi-asset class portfolios and for bonds risk premia.
As always we present several interesting figures and tables:
Visit Quantpedia to read notable quotations from the academic research paper.
Disclosure: Interactive Brokers
Information posted on IBKR Campus that is provided by third-parties does NOT constitute a recommendation that you should contract for the services of that third party. Third-party participants who contribute to IBKR Campus are independent of Interactive Brokers and Interactive Brokers does not make any representations or warranties concerning the services offered, their past or future performance, or the accuracy of the information provided by the third party. Past performance is no guarantee of future results.
This material is from Quantpedia and is being posted with its permission. The views expressed in this material are solely those of the author and/or Quantpedia and Interactive Brokers is not endorsing or recommending any investment or trading discussed in the material. This material is not and should not be construed as an offer to buy or sell any security. It should not be construed as research or investment advice or a recommendation to buy, sell or hold any security or commodity. This material does not and is not intended to take into account the particular financial conditions, investment objectives or requirements of individual customers. Before acting on this material, you should consider whether it is suitable for your particular circumstances and, as necessary, seek professional advice.
Join The Conversation
If you have a general question, it may already be covered in our FAQs. If you have an account-specific question or concern, please reach out to Client Services.