

")


See Part I for an intro to linear regression and logistic regression.
Example of logistic regression in trading
Logistic regression can be used in trading to predict binary outcomes (stock price will “increase” or decrease”) or classify data based on predictor variables (technical indicators). Here’s an example of how Machine learning logistic regression might be applied in a trading context:
Example: Predicting Stock Price Movement
Suppose a trader wants to predict whether a stock price will increase (1) or decrease (0) based on certain predictor variables or indicators. The trader collects historical data and selects the following predictor variables:
- Moving Average Crossover: A binary variable indicating whether there was a recent crossover of the short-term moving average (e.g., 50-day MA) above the long-term moving average (e.g., 200-day MA) (1 = crossover occurred, 0 = no crossover).
- Relative Strength Index (RSI): A continuous variable representing the RSI value, which measures the momentum of the stock (values range from 0 to 100).
- Trading Volume: A continuous variable representing the trading volume of the stock, which may indicate the level of interest or activity in the stock.
The trader builds a logistic regression model using historical data, where the outcome variable is the binary indicator of whether the stock price increased (1) or decreased (0) on the next trading day.
After training the logistic regression model, the trader can use it to make predictions on new data. For example, if the model predicts a high probability of a stock price increase (p > 0.7) based on past or current data, the trader may decide to buy the stock.
Types of logistic regression
Logistic regression is a versatile statistical method that can be adapted to various types of classification problems. Depending on the nature of the outcome variable and the specific requirements of the analysis, different types of logistic regression models can be employed.
Here are some common types of logistic regression:
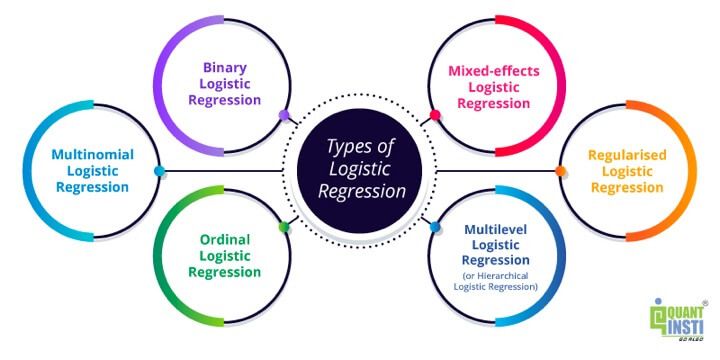
- Binary Logistic Regression: This is the most basic form of logistic regression, where the outcome variable is binary and can take on two categorical values, such as “yes” or “no,” “success” or “failure”. These values are read as “1” or “0” by the machine learning model.
Hence, binary logistic regression is used to model the relationship between the predictor variables (an indicator such as RSI, MACD etc.) and the probability of the outcome being in a particular category (“increase” or “decrease” in stock price).
- Multinomial Logistic Regression: In multinomial logistic regression, the outcome variable is categorical and can have more than two unordered categories. This type of logistic regression is suitable for modelling nominal outcome variables with three or more categories that do not have a natural ordering.
For example, classifying stocks into multiple categories such as “buy,” “hold,” or “sell” based on a set of predictor variables such as fundamental metrics, technical indicators, and market conditions.
- Ordinal Logistic Regression: Ordinal logistic regression is used when the outcome variable is ordinal, meaning that it has a natural ordering but the intervals between the categories are not necessarily equal. Examples of ordinal variables include Likert scale ratings (e.g., “strongly disagree,” “disagree,” “neutral,” “agree,” “strongly agree”). Ordinal logistic regression models the cumulative probabilities of the outcome variable categories.
For example, analysing the ordinal outcome of trader sentiment or confidence levels (e.g., “low,” “medium,” “high”) based on predictor variables such as market volatility, economic indicators, and news sentiment.
- Multilevel Logistic Regression (or Hierarchical Logistic Regression): Multilevel logistic regression is used when the data has a hierarchical or nested structure, such as individuals nested within groups or clusters. This type of logistic regression accounts for the dependence or correlation among observations within the same cluster and allows for the estimation of both within-group and between-group effects.
For example, Modelling the binary outcome of stock price movements within different industry sectors (e.g., technology, healthcare, finance) while accounting for the hierarchical structure of the data (stocks nested within sectors).
- Mixed-effects Logistic Regression: Mixed-effects logistic regression combines fixed effects (predictor variables that are the same for all observations) and random effects (predictor variables that vary across groups or clusters) in the model. This type of logistic regression is useful for analysing data with both individual-level and group-level predictors and accounting for the variability within and between groups.
For example, examining the binary outcome of stock price movements based on both individual-level predictors (such as company-specific factors, technical indicators) and group-level predictors (such as industry sector, market index etc.).
- Regularised Logistic Regression: Regularised logistic regression, such as Lasso (L1 regularisation) or Ridge (L2 regularisation) logistic regression, incorporates regularisation techniques to prevent overfitting and improve the generalisability of the model. Regularisation adds a penalty term to the logistic regression model, which shrinks the coefficients of the predictor variables and selects the most important predictors.
For example, building a binary classification model to predict whether a stock is likely to outperform the market based on a large number of predictor variables while preventing overfitting and selecting the most important features.
Each type of logistic regression has its assumptions, advantages, and limitations, and the choice of the appropriate model depends on the nature of the data, the type of outcome variable, and the specific research or analytical objectives.
Difference between logistic regression and linear regression
Now, let us see the difference between logistic regression and linear regression.
| Feature/Aspect | Linear Regression | Logistic Regression |
| Outcome Type | Continuous where the variable can take any value within a given range (e.g., daily stock price) | Binary or Categorical (e.g., Price is “Up” or “Down”) |
| Prediction | Value prediction. For example, stock price | Probability prediction For example, likelihood of an event |
| Relationship Assumption | Linear, that is, the dependent variable (such as predictive outcome) can be found out with the help of independent variables (such as past values). For example, on the basis of historical data, a trader can predict future prices of stock. | Log-Linear. For example, consider a situation where a quantity grows exponentially over time. A log-linear model would describe the relationship between the logarithm of the quantity and time as linear, implying that the quantity grows or decays at a constant rate on a logarithmic scale. |
| Model Output | Change in outcome per unit change in predictor | Change in log odds per unit change in predictor |
| Applications | Predicting in terms of amounts | Classifying in categories |
In essence:
- Linear Regression predicts a continuous outcome based on predictors.
- Logistic Regression estimates the probability of a categorical outcome based on predictors.
Key assumptions while using logistic regression
Logistic regression, like other statistical methods, relies on several key assumptions to ensure the validity and reliability of the results. Here are some of the key assumptions underlying logistic regression:
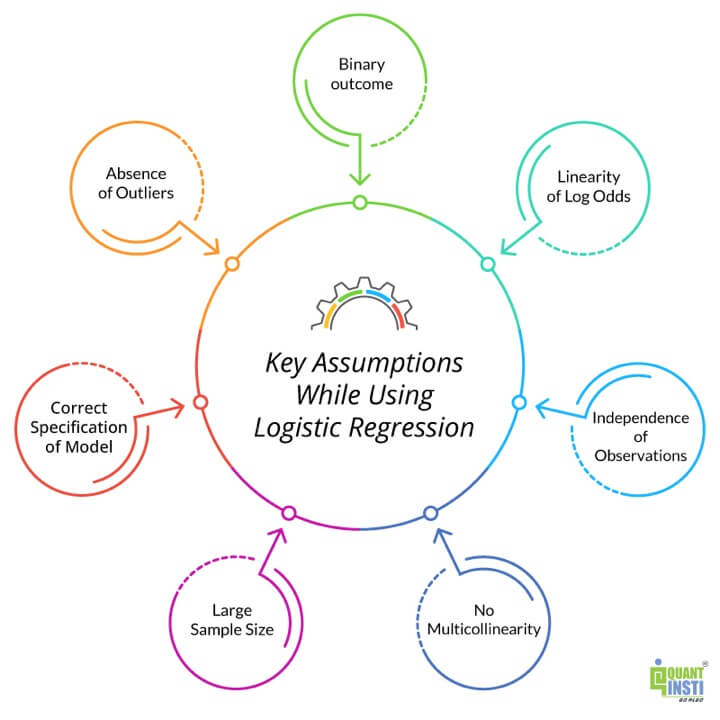
- Binary Outcome: Logistic regression is specifically designed for binary outcome variables, meaning that the outcome variable should have only two categorical outcomes (e.g., 0/1, Yes/No).
- Linearity of Log Odds: The relationship between the predictor variables and the log odds of the outcome should be linear. This assumption means that the log odds of the outcome should change linearly with the predictor variables.
- Independence of Observations: Each observation in the dataset should be independent of the other observations. This assumption ensures that the observations are not correlated or dependent on each other, which could bias the estimates and inflate the Type I error rate.
- No Multicollinearity: The predictor variables in the model should not be highly correlated with each other, as multicollinearity can make it difficult to estimate the individual effects of the predictor variables on the outcome.
- Large Sample Size: Logistic regression models perform better and provide more reliable estimates with a larger sample size (data values). While there is no strict rule for the minimum sample size, having a sufficiently large sample size ensures that the estimates are stable and the model has enough power to detect significant effects.
- Correct Specification of Model: The logistic regression model should be correctly specified, meaning that all relevant predictor variables should be included in the model, and the functional form of the model should accurately reflect the underlying relationship between the predictor variables and the outcome.
- Absence of Outliers: The presence of outliers in the dataset can influence the estimates and distort the results of the logistic regression model. It is essential to identify and handle outliers during data cleaning to ensure the robustness and validity of the model.
In summary, while logistic regression is a powerful and widely used method for modelling binary outcomes, it is crucial to ensure that the key assumptions of the model are met to obtain valid and reliable results. Violation of these assumptions can lead to biassed estimates, inaccurate predictions, and misleading conclusions, emphasising the importance of careful data preparation, model checking, and interpretation in logistic regression analysis.
Author: Chainika Thakar (Originally written By Vibhu Singh)
Stay tuned for Part III on how to use logistic regression in trading.
Originally posted on QuantInsti blog.
Disclosure: Interactive Brokers
Information posted on IBKR Campus that is provided by third-parties does NOT constitute a recommendation that you should contract for the services of that third party. Third-party participants who contribute to IBKR Campus are independent of Interactive Brokers and Interactive Brokers does not make any representations or warranties concerning the services offered, their past or future performance, or the accuracy of the information provided by the third party. Past performance is no guarantee of future results.
This material is from QuantInsti and is being posted with its permission. The views expressed in this material are solely those of the author and/or QuantInsti and Interactive Brokers is not endorsing or recommending any investment or trading discussed in the material. This material is not and should not be construed as an offer to buy or sell any security. It should not be construed as research or investment advice or a recommendation to buy, sell or hold any security or commodity. This material does not and is not intended to take into account the particular financial conditions, investment objectives or requirements of individual customers. Before acting on this material, you should consider whether it is suitable for your particular circumstances and, as necessary, seek professional advice.
Join The Conversation
If you have a general question, it may already be covered in our FAQs. If you have an account-specific question or concern, please reach out to Client Services.