

")


First edition.
Roberto Delgado Castro
Data Scientistl and Compliance Officer
robdelcas @ gmail.com
Introduction
One of the most known and used statistical tools is correlations.
Correlations are performed to find out levels of relations between two or more objects, variables or situations, in order to extract insights that bring explanations about the reasons why such objects or variables are, or not, related to each other.
The usage of correlations, in general terms, brings along the development of quantitative coefficients. The most famous are the Pearson and Spearman coefficients. These metrics are used to quantify the correlation analysis.
The correlation analysis could be applied to find relevant insights in daily business tasks or projects. Furthermore, it could be applied to find explanations for why determined business phenomena occur. Beyond, correlations could be used to solve problems in a wide variety of issues that appear daily in organizations, no matter their size, nature, type of operations, location or origin.
This article is based on the contents of my most recently published book: Correlations in R. (Free download from https://roberto-delgado.com/)
Correlation
Shao, Shirvan and Alamer (2022) express that “understanding the association between theoretical constructs is at the heart of quantitative research. Researchers use correlation to understand how two or more variables are associated. The relationship between variables is usually obtained by assessing how measures/scales that represent the variables are correlated. Analysts rarely use single items to represent a complex phenomenon because single items cannot appropriately capture the complexity inherent in theoretical concepts” .
In addition, Prasad (2023) indicates that “correlation and regression are the techniques which are used to investigate if there is a relationship between two quantitative variables. Correlation answers three questions—is there a relationship, what is the strength of relationship and direction of the relationship? Regression expresses this relationship in a mathematical form so that the equation can be used for predicting other values. However, correlation does not deal with causation, that is even a high degree of correlation cannot be used to confirm which is the cause and which is the effect variable. However, this condition is clearly defined in “regression or connection between two or more things. A more formal definition says, correlation is a statistical method used to assess a possible association between two or more variables”.
In these same ideas, Makowski, Ben-Shachar, Patil and Lüdecke (2020), point out that “correlations tests are arguably one of the most commonly used statistical procedures, and are used as a basis in many applications such as exploratory data analysis, structural modelling, data engineering etc.”
Therefore, according to the mentioned authors, the heart of correlation is finding some levels of association between two or more variables. At this point, it is possible to break down its definition.
First, a statistical-quantitative method or procedure must be performed. Second, researchers must find two or more variables, that could be objects, data sets or any other phenomenon. Third, such an association could be explained by the calculation of some coefficients. Fourth, the variables under analysis, in the majority of cases, are data sets or time-series-data made of information that have been collected within time.
Normality tests
Khatun (2021) expresses that “normality tests are used in different sectors”. Also, Das and Imon (2016), expresses that “in statistics it is conventional to assume that the observations are normal. The entire statistical framework is grounded on this assumption and if this assumption is violated the inference breaks down. For this reason it is essential to check or test this assumption before any statistical analysis of data”.
Also, Ahmad and Khan (2015), points that “standard statistical procedures often require data to be normally distributed and the results of these methods will be inappropriate when the assumption of normality is not satisfied. Therefore, the postulation of normality is strictly required before proceeding statistical analysis. Many parametric methods (like correlation, regression, t –test, analysis of variance etc) require normality assumption. The assumption of normality is one of the most important assumptions of parametric procedures because of its extensive range of practical applications”.
In addition, Ahmand and Khan also pointed that “researchers developed many tests for the comparison of normality assumption in different years; some tests were modified for attaining better performance. Firstly, Pearson (1900) developed chi-square test for detection of non-normality. Kolmogrov and Smirnov (1933) suggested formal test for normality. The chi square test, based on acumulative distribution function, and can be used for any univariant distribution. After two decades, Anderson and Darling proposed their test for normality. Kuiper (1960) brought out the test of normality. Afterwards, Shapiro and Wilk (1965) suggested test of normality. In 1968, Ajne normality test was developed. After two years later, a modification of Kuiper and Ajne tests was proposed by Stephens (1970). D’Agostino (1972) introduced another test of normality. In the same year, modification of Kolmogrov Smirnov was proposed by Stephens. Four years later, Vasicek’s test of normality proposed by Vasicek (1976). Jarque and Bera designed a test of normality in 1987”.
Therefore, Hernandez (2021) expresses that “ determining whether or not a data sample has been obtained from a normally-distributed population is a common practice in statistics and data analysis. Up to this date, several dozens of methods have been proposed in the scientific literature for testing normality”.
According to the bibliography reviewed so far related with normality tests, from a pure statistical point of view, before applying any quantitative processing applied to a determined data set or variable, it is recommended to perform any kind of normality test, in order to determine whether or not such data set (variable) is normal or not.
Why?
Dagnino (2014) states that “many times, when two variables that change together are measured, it is possible to determine which is independent and which is dependent. In these circumstances, it is only possible to describe the strength of association between them, since not causal predictions or estimates can be made”.
From this point on, the work of comparing and relating two variables constitutes one of the most used and common scientific works in the world of research and statistics. The collection of data for the construction of time series on particular variables, and the development of coefficients that quantify the association between them, are one of the cornerstones in what is known as Linear Regression.
Fiallos (2021) states that “the most common numerical index used to measure a correlation is the “Pearson Coefficient”. Pearson’s Coefficient (also called the product-momentum correlation coefficient), is represented by the symbol “r” and provides a numerical measure of the correlation between two quantitative variables. This coefficient has the following characteristics:
- It tells us whether two variables are correlated or not.
- It tells us whether the apparent relationship is positive or negative.
- The coefficient sign denotes the strength or intensity of the correlation between the variables”.
It is particularly important to note that, if the data collected is parametric and numerical and follow a normal distribution trend, Pearson’s Coefficient should be used. On the other hand, if you are working with data that is not parametric or follows a normal distribution trend, it is best to use, among others, the so-called Spearman’s Coefficient. As Pinilla and Rico (2021) put it, “analyses based on Pearson’s Coefficient are known as parametric, and those based on Spearman’s Coefficient are known as non-parametric”.
Correlation coefficients: Pearson and Spearman
According to Schober, Boer and Schwarte (2018), “the Pearson correlation coefficient is typically used for jointly normally distributed data (data that follow a bivariate normal distribution). For nonnormally distributed continuous data, for ordinal data, or for data with relevant outliers, a Spearman rank correlation can be used as a measure of a monotonic association. Both correlation coefficients are scaled such that they range from –1 to +1, where 0 indicates that there is no linear or monotonic association, and the relationship gets stronger and ultimately approaches a straight line (Pearson correlation) or a constantly increasing or decreasing curve (Spearman correlation) as the coefficient approaches an absolute value of 1. Hypothesis tests and confidence intervals can be used to address the statistical significance of the results and to estimate the strength of the relationship in the population from which the data were sampled”.
Specifically in R, due to the functions of the package RSTATIX, Shapiro-Wilk normality tests and Pearson and Spearman coefficients could be calculated using a certain code structure. Within the next sections of this book, a proper code structure is proposed in order to perform such calculations.
RStatix package
According with the formal prospect, “RSTATIX package is a pipe-friendly framework for basic statistical tests”. Provides a simple and intuitive pipe-friendly framework, coherent with the ‘tidyverse’ design philosophy, for performing basic statistical tests, including t-test, Wilcoxon test, ANOVA, Kruskal- Wallis and correlation analyses. The output of each test is automatically transformed into a tidy data frame to facilitate visualization. The package contains helper functions for identifying univariate and multivariate outliers, assessing normality and homogeneity of variances”.
Correlations in R: proposed check list using R-Statix
The following image shows the suggested process of correlation analysis:
Image 1
Correlation analysis in R
Recommended process diagram
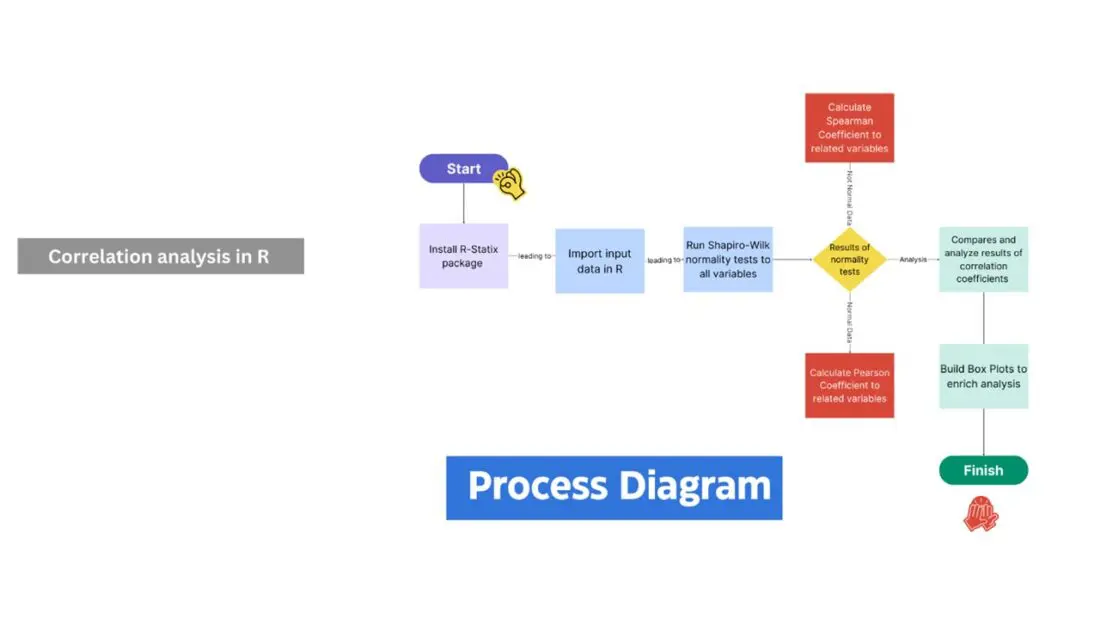
- Install R-Statix package: library(rstatix)
- Input data in R (ingest) using read(r) function.
- Run Shapiro-Wilk normality tests using Shapiro_test function, applied to variables under analysis.
- Compare results of normality tests within variables under analysis.
- Calculate correlation coefficients to variables under analysis, depending on normality tests results for each:
o Pearson Coefficient: cor.metod = Pearson
o Spearman Coefficient: cor.metod = Spearman.
Closure
The use of statistics provides real data on complex situations rather than making decisions based on assumptions. A manager must have the ability to look at data and make predictions about the future of the company or a particular department. Nowadays, every decision must be supported by concrete empirical data.
Correlations could be applied in business analytics. Some of its uses could be:
- Data exploratory analysis.
- Predictions and data modeling.
In addition, correlation is a powerful statistical tool that helps researchers to discover associations and relations between variables. When they examine the strength and the association between two or more variables, the correlation analysis lets them obtain crucial information about behaviors, preferences, tendencies of processes and markets.
References
Shao, K., Elahi Shirvan, M., & Alamer, A. (2022). How accurate is your correlation? Different methods derive different results and different interpretations. Frontiers in Psychology, 13, 901412.
Prasad, S. (2023). Correlation and Regression. In Elementary Statistical Methods (pp. 241-279). Singapore: Springer Nature Singapore.
Makowski, D., Ben-Shachar, M. S., Patil, I., & Lüdecke, D. (2020). Methods and algorithms for correlation analysis in R. Journal of Open Source Software, 5(51), 2306.
Khatun, N. (2021). Applications of normality test in statistical analysis. Open Journal of Statistics, 11(01), 113.
Das, K. R., & Imon, A. H. M. R. (2016). A brief review of tests for normality. American Journal of Theoretical and Applied Statistics, 5(1), 5-12.
Ahmad, F., & Khan, R. A. (2015). A power comparison of various normality tests. Pakistan Journal of Statistics and Operation Research, 331-345.
Hernandez, H. (2021). Testing for normality: What is the best method. ForsChem Research Reports, 6, 2021-05.
Dagnino, J. (2014). Coeficiente de correlación lineal de Pearson. Chil Anest, 43(1), 150-153.
Fiallos, G. (2021). La Correlación de Pearson y el proceso de regresión por el Método de Mínimos Cuadrados. Ciencia Latina Revista Científica Multidisciplinar, 5(3), 2491-2509.
Pinilla, J. O., & Rico, A. F. O. (2021). ¿Pearson y Spearman, coeficientes intercambiables? Comunicaciones en Estadística, 14(1), 53-63.
Schober, P., Boer, C., & Schwarte, L. A. (2018). Correlation coefficients: appropriate use and interpretation. Anesthesia & analgesia, 126(5), 1763-1768.
R-Statix package prospect. Updated February 1st, 2023.
URL: https://cran.r-project.org/web/packages/rstatix/index.html
See below for other Data Science articles from Roberto Delgado Castro:
- Absolute and Relative Time: The Impact of Data Science
- Rudder Casting: Defining the Heart of a Data Warehouse
- R Quarto©: New Boundary In Financial Reporting Services
- Pivot Tables in R For Financial Analysis of Public Trusts in Costa Rica
Disclosure: Interactive Brokers
Information posted on IBKR Campus that is provided by third-parties does NOT constitute a recommendation that you should contract for the services of that third party. Third-party participants who contribute to IBKR Campus are independent of Interactive Brokers and Interactive Brokers does not make any representations or warranties concerning the services offered, their past or future performance, or the accuracy of the information provided by the third party. Past performance is no guarantee of future results.
This material is from Roberto Delgado Castro and is being posted with its permission. The views expressed in this material are solely those of the author and/or Roberto Delgado Castro and Interactive Brokers is not endorsing or recommending any investment or trading discussed in the material. This material is not and should not be construed as an offer to buy or sell any security. It should not be construed as research or investment advice or a recommendation to buy, sell or hold any security or commodity. This material does not and is not intended to take into account the particular financial conditions, investment objectives or requirements of individual customers. Before acting on this material, you should consider whether it is suitable for your particular circumstances and, as necessary, seek professional advice.
Join The Conversation
If you have a general question, it may already be covered in our FAQs. If you have an account-specific question or concern, please reach out to Client Services.