


Learn how to get historical data for stocks with Part I and how to convert 1-minute data to 1-hour data or resample stock data with Part II.
Fundamental Data
We have used yfinance to get the fundamental data.
The first step is to set the ticker and then call the appropriate properties to get the right stock market data.
If yfinance is not installed on your computer, then run the below line of code from your Jupyter Notebook to install yfinance.
!pip install yfinance
install yfinance.py hosted with ❤ by GitHub
# Import yfinance
import yfinance as yf

# Set the ticker as MSFT
msft = yf.Ticker("MSFT")
Import yfinance and set the ticker.py hosted with ❤ by GitHub
Key Ratios
You can fetch the latest price to book ratio and price to earnings ratio as shown below.
# get price to book
pb = msft.info['priceToBook']
pe = msft.info['regularMarketPrice']/msft.info['trailingEps']
print('Price to Book Ratio is: %.2f' % pb)
print('Price to Earnings Ratio is: %.2f' % pe)
Get price to book.py hosted with ❤ by GitHub
Revenues
# show revenues
revenue = msft.financials.loc['Total Revenue']
plt.bar(revenue.index, revenue.values)
plt.ylabel("Total Revenues")
plt.show()
Revenue.py hosted with ❤ by GitHub

Earnings Before Interest and Taxes (EBIT)
EBIT = msft.financials.loc['Earnings Before Interest and Taxes']
plt.bar(EBIT.index, EBIT.values)
plt.ylabel("EBIT")
plt.show()
EBIT.py hosted with ❤ by GitHub

Balance sheet, cash flows and other information
# show income statement
msft.financials
# show balance heet
msft.balance_sheet
# show cashflow
msft.cashflow
# show other info
msft.info
Show information.py hosted with ❤ by GitHub
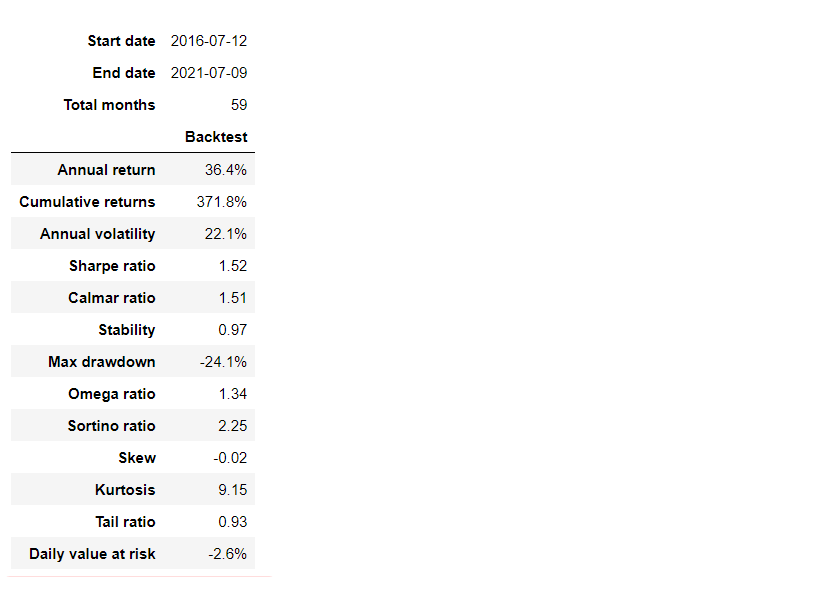
Stock Market Data Visualization and Analysis
After you have the stock market data, the next step is to create trading strategies and analyse the performance. The ease of analysing the performance is the key advantage of the Python.
We will analyse the cumulative returns, drawdown plot, different ratios such as
- Sharpe ratio,
- Sortino ratio, and
- Calmar ratio.
Here’s an article that describes the above ratios: Portfolio Allocation and Pair Trading Strategy using Python
I have created a simple buy and hold strategy for illustration purpose with four stocks namely:
- Apple
- Amazon
- Microsoft
- Walmart
To analyse the performance, you can use the pyfolio tear sheet as shown below.
Install pyfolio if not already installed, as follows:
# If you already have a version of pyfolio on your system you can remove that using !pip uninstall pyfolio and then run the following code
!pip install pyfolio-reloaded==0.9.5
Install pyfolio-reloaded.py hosted with ❤ by GitHub
# Define the ticker list
tickers_list = ['AAPL', 'AMZN', 'MSFT', 'WMT']

# Import pandas and create a placeholder for the data
import pandas as pd
data = pd.DataFrame(columns=tickers_list)

# Fetch the data
import yfinance as yf
for ticker in tickers_list:
     data[ticker] = yf.download(ticker, period='5y',)['Adj Close']

# Compute the returns of individual stocks and then compute the daily mean returns.
# The mean return is the daily portfolio returns with the above four stocks.
data = data.pct_change().dropna().mean(axis=1)

# Import Pyfolio
import pyfolio as pf

# Get the full tear sheet
pf.create_full_tear_sheet(data)
pyfolio_plot.py hosted with ❤ by GitHub
Originally posted on QuantInsti blog.
Disclosure: Interactive Brokers
Information posted on IBKR Campus that is provided by third-parties does NOT constitute a recommendation that you should contract for the services of that third party. Third-party participants who contribute to IBKR Campus are independent of Interactive Brokers and Interactive Brokers does not make any representations or warranties concerning the services offered, their past or future performance, or the accuracy of the information provided by the third party. Past performance is no guarantee of future results.
This material is from QuantInsti and is being posted with its permission. The views expressed in this material are solely those of the author and/or QuantInsti and Interactive Brokers is not endorsing or recommending any investment or trading discussed in the material. This material is not and should not be construed as an offer to buy or sell any security. It should not be construed as research or investment advice or a recommendation to buy, sell or hold any security or commodity. This material does not and is not intended to take into account the particular financial conditions, investment objectives or requirements of individual customers. Before acting on this material, you should consider whether it is suitable for your particular circumstances and, as necessary, seek professional advice.
Join The Conversation
If you have a general question, it may already be covered in our FAQs. If you have an account-specific question or concern, please reach out to Client Services.