


Study Notes:
When users log in to IBKR Desktop, by default they will see the Positions tab within the Portfolio.
By selecting an instrument, a basic thumbnail chart displays in the panel to the right.
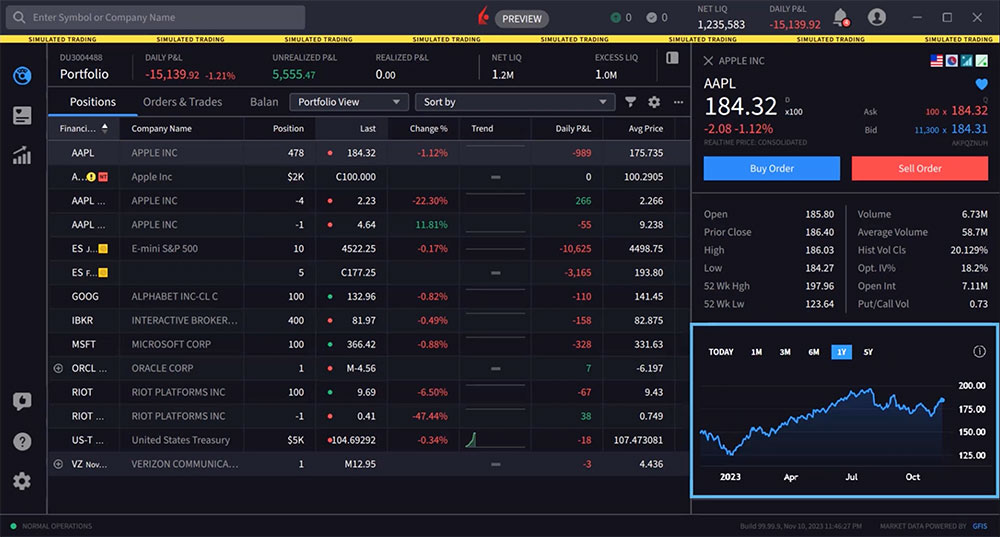
However, users may launch a full-size chart area by either double-clicking on a symbol or by clicking the Quote icon in the left panel.
The Quote Panel is comprised of two panels. By default, the Quote panel opens with the Charts tab selected. Users may also access Option Chains within the Quote panel by clicking on the tab above.
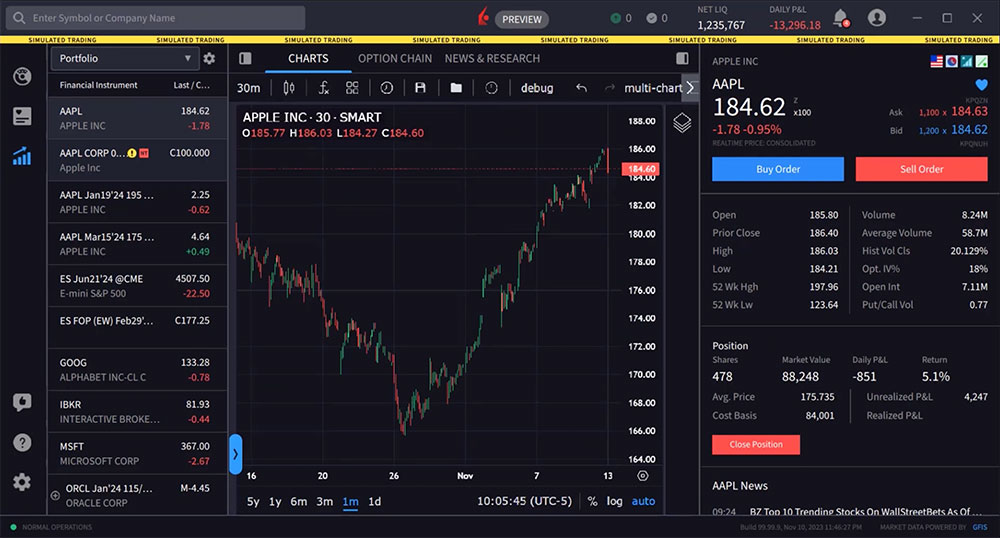
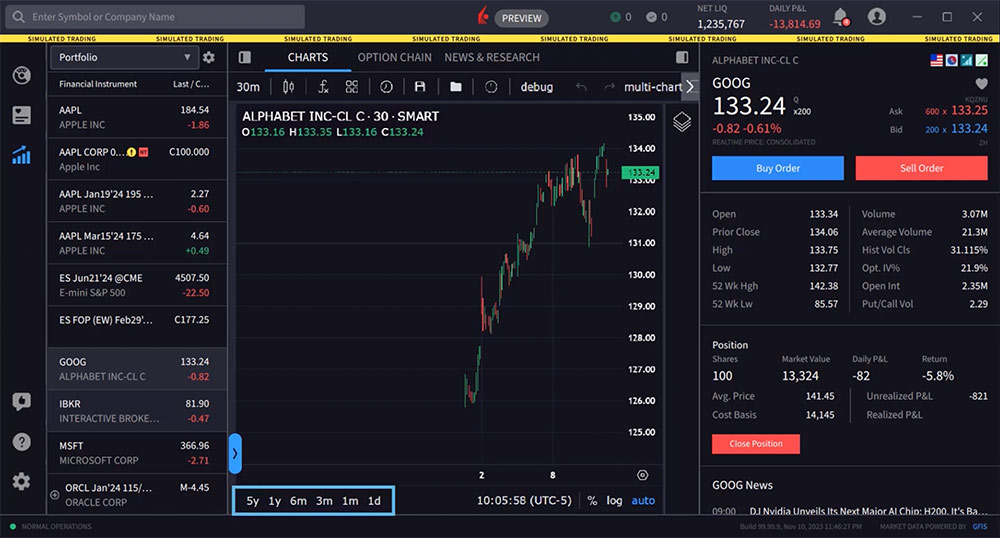
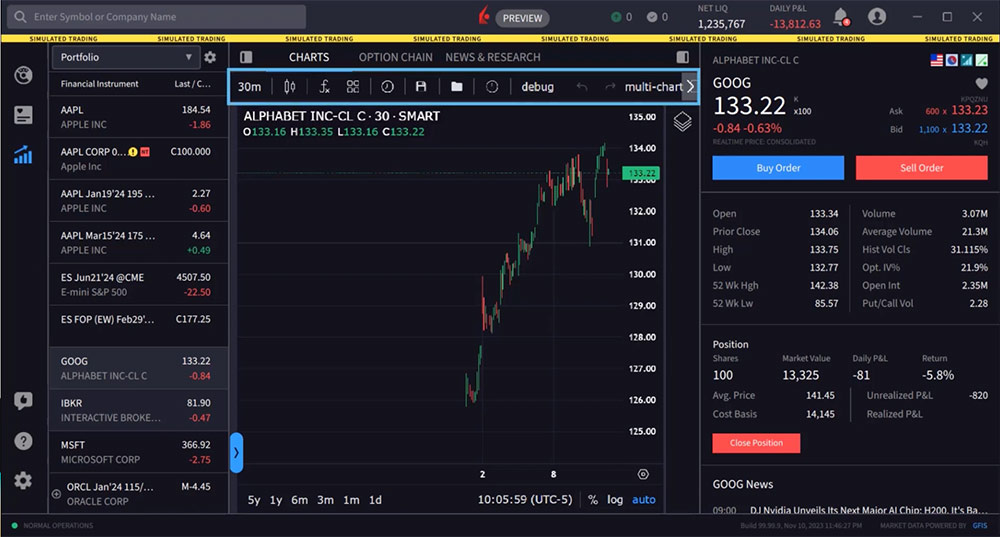
To change the symbol in your chart, select an asset from the Financial Instrument section of the Quote panel.
Changing Time Display
The user can change the time period displayed from the lower left of the chart by clicking on any of the desired time period buttons.
Using the icons along the top of the chart, the user may change the periodicity of the chart display from intraday to daily, weekly etc. For example, let’s choose a symbol and set the display to 1y below the chart. Now, let’s use the icon to the upper left to switch from Day to Week.
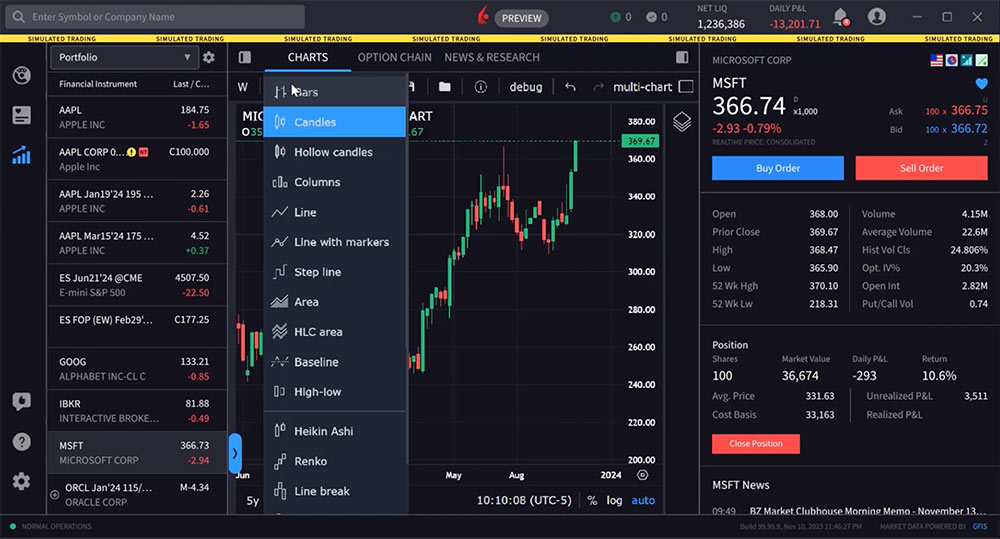
Changing Chart Type
To the right, user may choose from the icon an array of different chart types, from candles, lines, high-low, Heikin Ashi and Point & Figure charts.
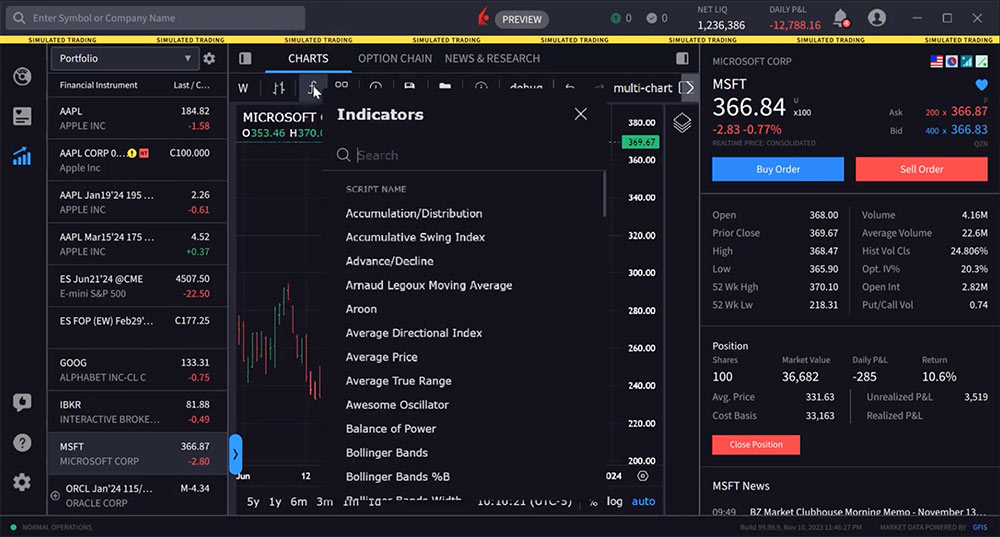
Adding Chart Indicators
Click the indicators icon to display a list of available studies to add to the display. The user may scroll down the list or enter a search term. In this case user is looking for ‘moving average’ and starts to type in the input field. Click the desired indicator to add immediately to the chart. By hovering above the study data beneath the ticker symbol, floating icons appear to the right of the added study and user may hide, see settings or delete the study. In this case user selects settings and can adjust the study inputs to change the settings and click ‘ok’.
Once the user has added a series of indicators to a chart, it may be saved as an indicator template by tapping the four-squares icon and entering a name followed by ‘save’. Saved templates may be accessed by clicking this icon later.
They can also save applied indicators as a template, show or hide Outside Regular Trading Hours data, and save the current chart as a snapshot.
Accessing Drawing Tools
Drawing tools are concealed behind a blue arrow along the lower left edge of the chart. Click that to expand the drawing tools panel. Here the user may click an icon to use a drawing tool. When active, the tool icon is blue. Here, at the top of the icon set, the user can click on or off the chart crosshairs. Use the tools to draw Fibonacci Retracement, Trend Lines and more. Hold your mouse over an icon to see the extended tool menu when applicable. To remove drawings and indicators from the display, the user would right click on a trend or Fibonacci line and select ‘remove’.
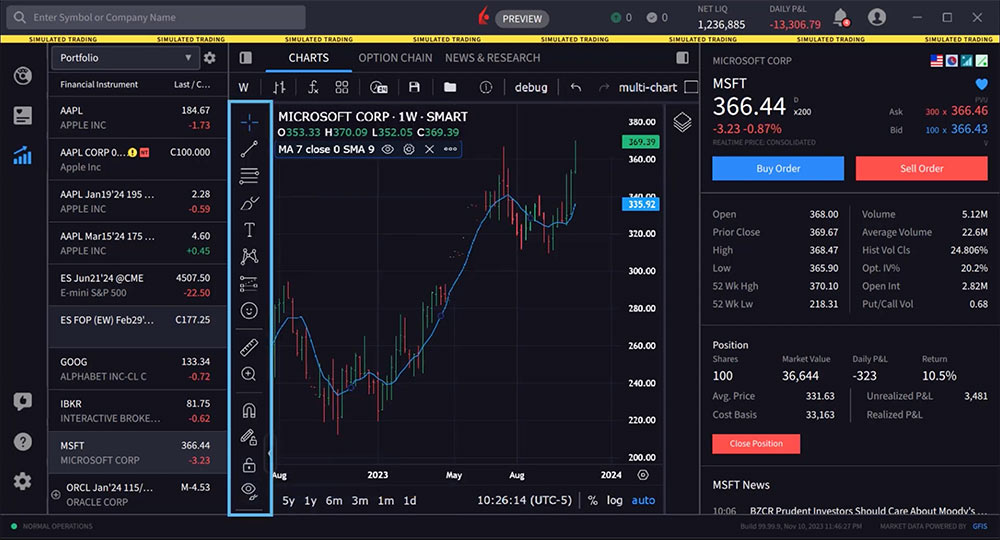
You can increase the size of your chart by hiding the left and right-side panels. Note the Show/Hide panel icons to the upper right and left of the chart. Simply click one or both of these Show/Hide Panel icons to maximize the display.
Note that if the user hides the left panel, which includes the Financial Instruments, they will not be able to change the symbol in the chart. The left side panel must be reopened to select a symbol.
Increasing the Display to Multi-Chart Mode
The user may view multiple charts using multi-chart mode. The multi-chart icon is labelled to the upper right of the display. Click the multi-chart icon to reveal layout choices for up to eight styles.
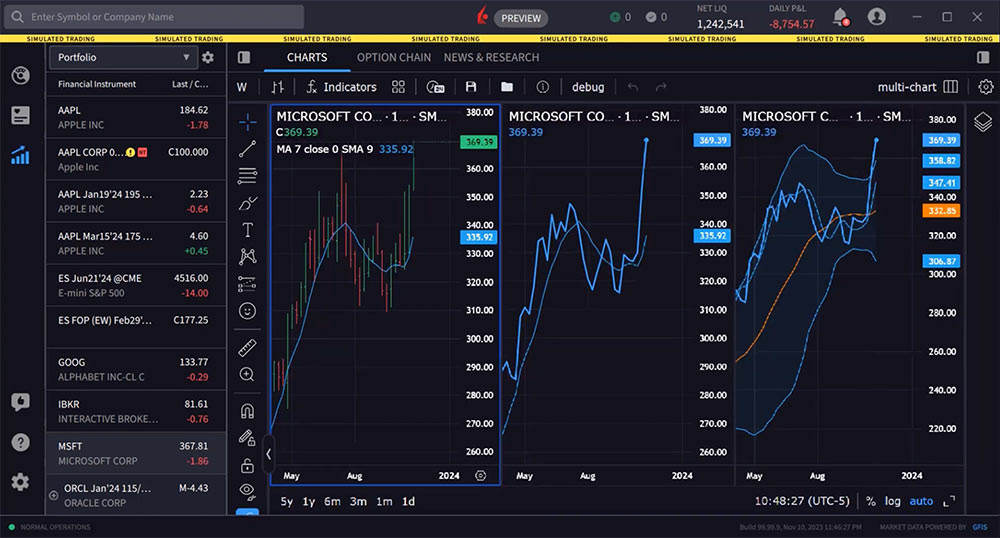
The user may display multiple charts that use the same symbol in each panel by activating Sync in Layout – Symbol. You can also sync up the charts’ interval, crosshair, and time period.
Alternatively, show multiple charts with different symbols by disabling Sync in Layout.
Load different symbols in your charts by selecting a chart and then clicking an asset in the Financial Instrument section.
Chart Customization
Finally, click the gear icon on the top right above the chart for customization options, such as changing colors, labels, background, gridlines and more.
Resources
The lesson is good
Thanks for tuning in!
Are ratio charts available and if so are there alerts on them ?
Hello, thank you for reaching out. Ratio charts are available in TWS Mosaic. You can find them by right clicking the chart and clicking Virtual Security. Please view this FAQ with instructions to set up alerts with Charts in Trader Workstation: https://www.ibkr.com/faq?id=27279175
We hope this helps!
excellent to get familiar with the system.
Thanks for engaging!
Way simpler than TWS to understand and operate.
We appreciate your feedback.
Thank you. I learnt a lot in my first lesson.
We hope you continue to enjoy Traders’ Academy!
Hi,
Is there an option to change the chart timezone to the exchange timezone? It is currently set to the local timezone (Singapore) which is UTC+8. However, if I am trading US stocks, I need to convert the time to US time zone.
Thanks
Hello Kevin, thank you for your question. It is possible to change your TWS time zone the moment you log in to TWS: click on More options at the bottom left corner of the TWS login screen, then click on the Time Zone button to choose your TWS time zone and click OK. Then enter your Username and Password and click on Login. Please reach back out with any more questions. We are here to help!
Hi,
Thanks for the reply. Is it the same for IBKR Desktop app?
Thanks
Hello again. Yes, you can change the Time Zone on IBKR Desktop when you log in. Click the “More Options” button in the lower right-hand corner, and “Time Zone” will pop up on the right-hand side of the screen. We hope this helps!
How do I change the candles to match the exchange time? i.e. for New York Time (UTC-5) . I am living outside of US.
Hello Jignesh, thank you for reaching out. To change the time zone for IBKR Desktop, please click “More Options” in the login window. If that does not work, please try to uninstall then reinstall IBKR Desktop. We hope this achieves the result you’re looking for!
In IBKR Desktop App, I tried changing the Timezone to suit the exchange time. However, in IBKR Ao\pp, it does not change the timezone when chart appear on the screen
very good
if i wish to leave drawings (colored lines as examples on the chart how do i save them so they remain with the correct color etc.? I’ve tried to select a line and save as template XYZ but that doesn’t work, How do i save that particular say ES symbol to always have the drawings and even transfer to the next contract at rollover?
Hello, thank you for reaching out. When adding futures market data to a watchlist or trading page, select a continuous futures contract to avoid having to manually roll or re-enter expiring contracts. Please view this User Guide for more instructions: https://www.ibkr.com.hk/en/software/tws/usersguidebook/technicalanalytics/continuous.htm
We hope this helps!
this
is in reference to the new desktop version
Is there a way to either “pop out” the charts, or to relocate them on my computer screens, and save that as the default? I would prefer to view multiple charts at the same time as viewing my entire watchlist with all of its columns?
Hello Chris, thank you for asking. Have you tried out multi-chart mode? You can learn more about it here: https://ibkrcampus.com/trading-lessons/ibkr-desktop-sync-multi-chart-mode/
At this point in time you cannot set up multiple charts across multiple monitors, but we are working on a feature that will allow customizing windows which should include what you are requesting. We unfortunately don’t have the ETA.
Hi,
Would like to ask on the IBRK Desktop app, is there any way to set the time zone to “Exchange”. For example, I am currently in Singapore and if I trade D05 the time zone should show (UTC + 8) and if I trade AAPL the time zone should switch to (UTC – 5).
Currently the chart seems to be only able to show one time zone (ie Singapore UTC + 8). If I were to trade different markets, I would need to convert the time manually.
Thanks
Hello Kevin, thank you for reaching out. It is possible to change your time zone on IBKR Desktop from the moment you log in. In the bottom right corner, click More Options> Time Zone. This will allow you to pick any time zone you desire. In the future, please post in the Feature Poll in Client Portal where other IBKR users can comment and vote:
https://portal.interactivebrokers.com/portal/#/suggestions
We appreciate your feedback!
Muy buena lección
Thanks for engaging!
Very good explanations
Thanks for engaging!
I am using multi monitors, how do I detach the chart to move it into other monitor. ?
Hello Ray, thank you for reaching out. In Classic TWS, click the + symbol at the bottom of the screen. Then enter the desired tickers you would like to create a chart for in a watchlist. Then right click each ticker and click “New Chart”. You should be able to drag the two charts to different monitors.
We hope this helps!
Is there a way to change the candles from 30 seconds to 10 seconds? Thanks
We appreciate your question, Manuel. At the top left of the chart is the current time period displayed in the chart, while along the bottom left of the chart is the selected timeframe. You can click on one-month or three-month to change the time frame. And adjust the candle period by clicking on the current value in the upper left to reveal a dropdown containing additional time periods. Note: You may also enable/disable real-time hours by clicking this icon in the top row.
We hope this helps!
unfortunately 30 seconds seems to be the lowest possible, i also tried searching for intervall on the magnifying glass at the right and the lowest i could type in was 30 seconds.
The time periods on my platform screen only show “1d 1m 3m 6m” . There is no 1y and 5y period consistent with the one shown on the Introduction to Charts tutorial. Moreover, when I access the time drop down tab, the sections pertaining to days is muted and therefore inoperable. How may I activate the days section along with adding the 1Y and 5Y periods on the lower left of the screen? Thank you.
Hello, we appreciate your question. The time frame you currently see on the platform is on Advanced Charts in TWS. The 1y and 5y period consistent with the one shown on the Introduction to Charts tutorial is found in IBKR Desktop. IBKR Desktop combines the best of both proven and new technologies. We’ve included many of the most popular tools from our flagship TWS along with a growing suite of original new features like Option Lattice and Screeners with MultiSort. This perfect synthesis of the known and the novel combined with our superior order execution results in a sleek, speedy platform that’s easy to navigate but still packs a punch in the features department. You can download the software here:
https://spr.ly/IBKR_PlatformsCampus
To see real time quotes in a chart, you need to subscribe to real time market data from Client Portal.
https://spr.ly/IBKRMarketDataCampus
Please view this FAQ for more information: https://www.ibkr.com/faq?id=40347241
We hope this helps!