


Study Notes:
The Options Lattice enables the user to view a chart depicting the 30-day price history for a stock alongside an array of bubbles measuring relative volume or value for key metrics across expirations and strike prices. The user may better visualize the footprint of option activity within the marketplace by comparing bubble sizes for calls or puts indicating option volume, open interest or implied volatility. Such metrics allow the user to understand where options activity is taking place both in today’s market and building over time by focusing on volume and open interest.
The display is user-configured to focus on the range of strike prices they wish to see over their own defined time period. Users can hover over the bubbles for pop-up details per options strike. From the same window they can click to create an order in a single option or activate the Strategy Builder to create combination trades.
Starting from the Quote icon in the left side navigation panel locate and click the Option Chain icon. Then select the Option Chain tab from the top menu. Note that the default view displays the Order Panel to the right. In order to maximize the real estate, users may click the hide/show icon to the top right.
IBKR Desktop’s Option Chain provides three views, which the user may change by clicking the icon between the Strategy Builder and Configuration icons to the upper right. Clicking the icon reveals a selection of three views:
- Tabs View, where a single expiration at a is displayed time using tabs along the top of the chain.
- List View, which shows all expirations listed down the left-hand side of the Option Chain
- Lattice View, which is a graphical view highlighting potential outliers in key metrics, such as Implied Volatility, Open Interest, Volume, or Last Price.
Across the top of the page are options-related metrics for the stock. Change the symbol as usual by entering the desired ticker into the box to the upper left and making the appropriate selection.
Let’s see next how to control the information displayed on screen. To do this let’s review the drop-down menu containing several criteria. Notice how the display updates automatically as each choice is changed.
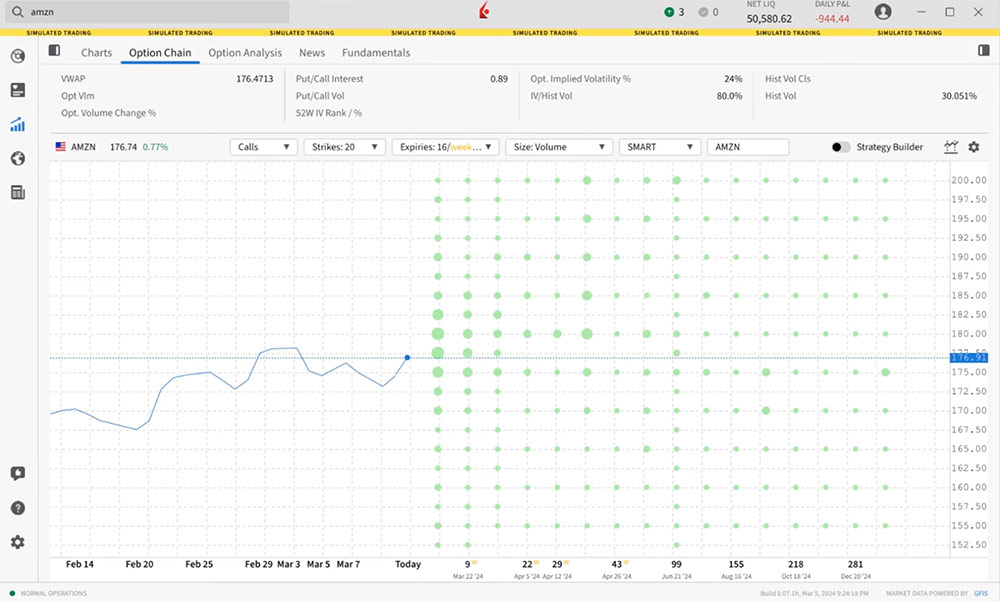
By selecting more expirations and more strike prices, the user sees all available data and can hone-in later by changing things from the drop-down criteria.
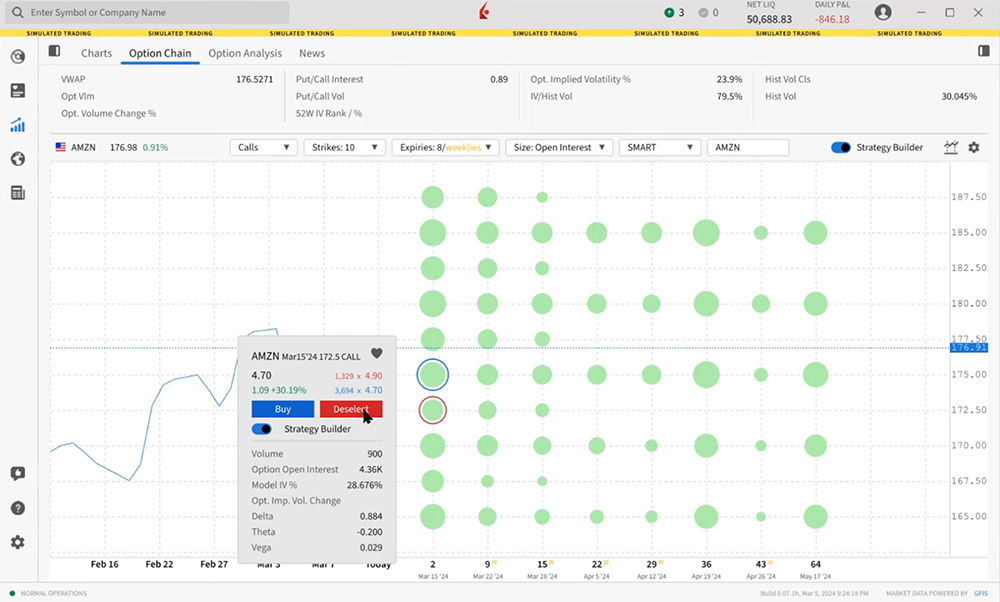
To the left of the display, the blue line shows the prior 30-day price display for the underlying symbol and is measured on the Y-axis. Notice beneath the chart the Today label depicting the current trading price of the stock. Each horizontal line depicts surrounding strikes and is again shown on the right axis. Days to expiration are shown across the X-axis beneath the chart and labelled with the actual date. Now the user may see the path of the stock during the last month, plus an array of strikes across time above and below the current trading price.
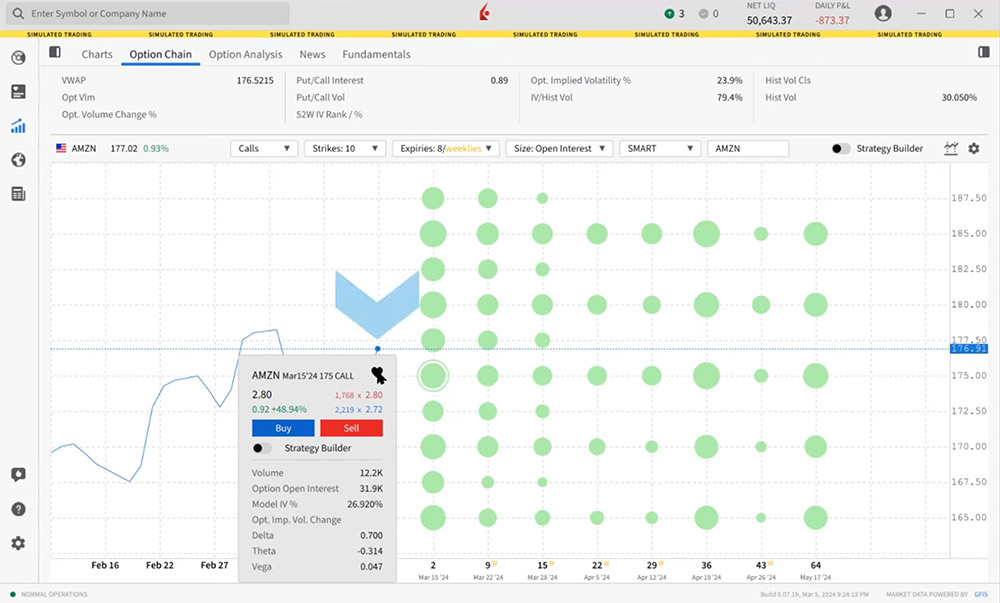
From the dropdown boxes above the chart, user chooses either Puts or Calls. Put options display as lavender bubbles. Call options display in green.
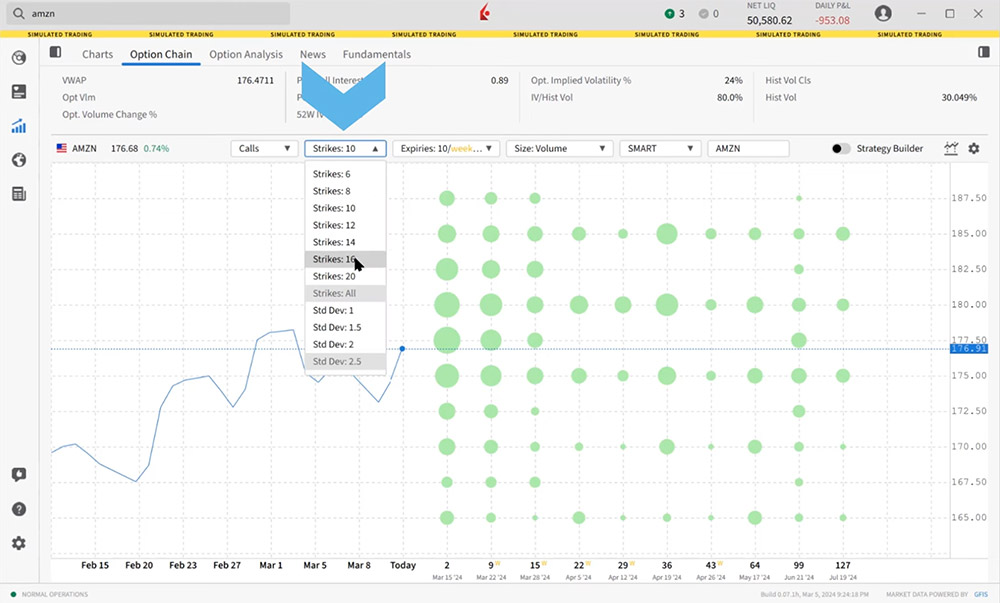
Modify the number of Strikes and Expiries. Users will see the change in the number of strikes shown along the Y-axis. Changes to the number of expiries is reflected along the X-axis. We suggest maximizing the number of strikes and expiries to see the overall picture before trimming down for better overall focus.
Bubble size is based on the value of the key metrics. Choose from Volume, Open Interest, Last Price, or Implied Volatility (%).
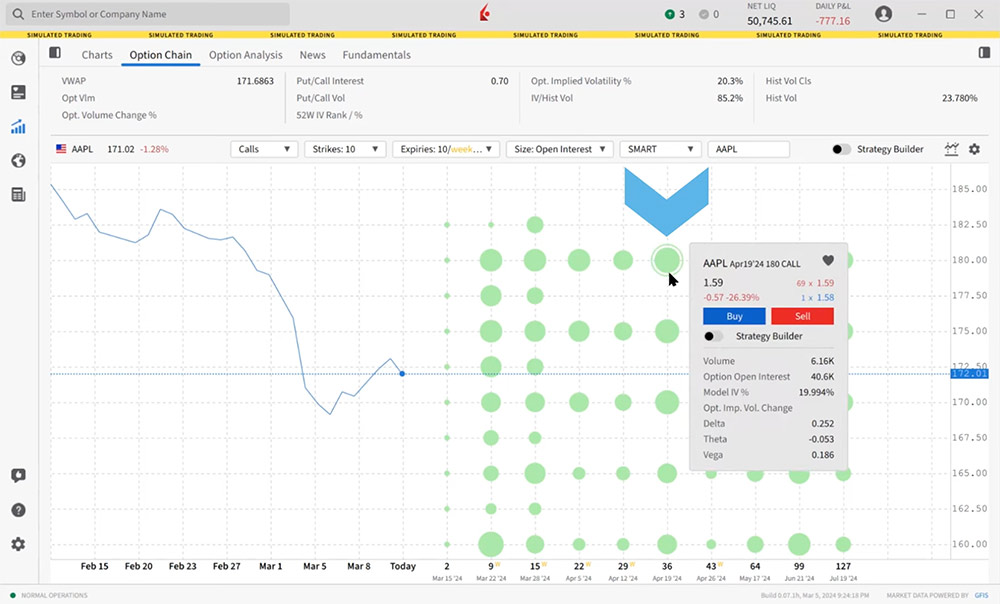
The user can see more easily where open interest is building, or by selecting Volume from the drop-down can see today’s most active strikes. Once the display criteria is defined, hovering the mouse over a bubble displays details about the option. The options description and quote details are displayed at the top of the panel. Metrics and some option Greeks are displayed in the lower part of the panel. To save any option to a watchlist, click the heart icon and choose a watchlist.
On the pop-up window users may click the Buy or Sell buttons to create a single-legged order. To create multi-legged combination orders, toggle on the Strategy Builder before clicking Buy or Sell buttons to create the first leg of a multi-leg option strategy. Click the next option to display the next pop-up box and use the Buy or Sell buttons to add another leg. To save any options combination to a watchlist, access the Quote Panel to the right (users may need to click the hide/display icon at the top right of the page) click the heart icon and choose a watchlist. Orders may be submitted from the Order Panel to the right of the screen.
Resources
Join The Conversation
If you have a general question, it may already be covered in our FAQs. If you have an account-specific question or concern, please reach out to Client Services.