


![[Gamma] Scalping Please](https://ibkrcampus.com/wp-content/smush-webp/2024/04/tir-featured-8-700x394.jpg.webp "[Gamma] Scalping Please")


Study Notes:
In this lesson, you will learn about some of the toolbar icons, what they enable users to do and how they work. By the end of the lesson, you will have a better understanding of the functionality of several key icons and how they can be used to make your charting experience easier in TWS.
Access the Toolbar
Let’s start by reminding you how to access the toolbar and how to turn it on and off.
While clicking the ‘x’ button will hide the toolbar, you can add it using the View dropdown menu above the chart and clicking on the radio button.
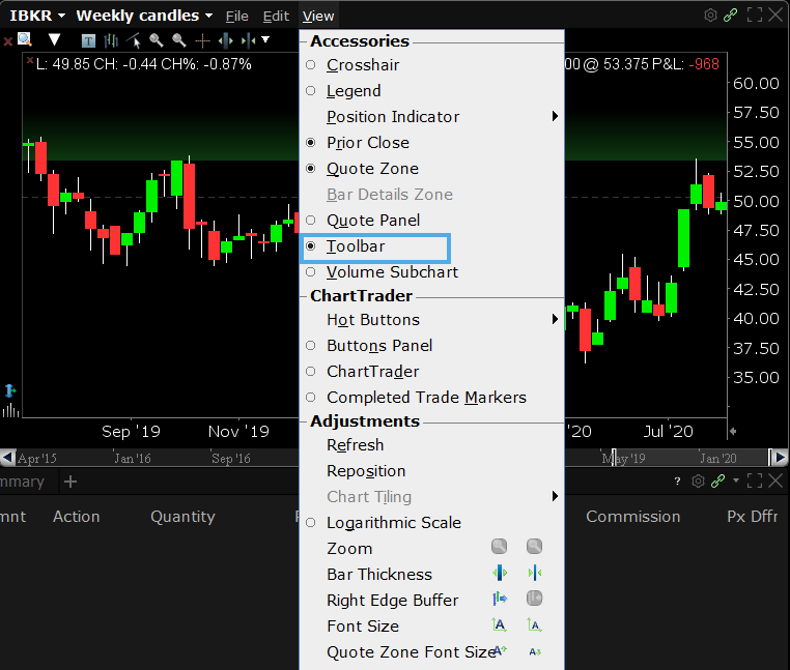
Let’s take a look at one of the icons by checking the Chart Parameters icon.
![]()
Now, the familiar Chart settings window appears as we’ve explored in another lesson and you can see across the top of the page tabs associated with adding a financial instrument, a study, secondary series and comparing to an index.
From the Chart Parameters tab, you can change the Underlying ticker, change the Time Period or bar type, create additional data for display and so on.
I’ll click OK to close the Chart Parameters window.
Financial Instrument icon
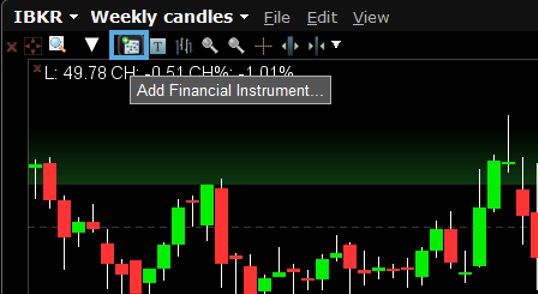
If I now hover above the Add Financial Instrument icon and click it, TWS creates a Chart Settings window that goes to the Secondary Series tab. Add any other ticker – perhaps that of a competitor – just by entering the ticker into the Underlying box.
You can make various selections from the Source dropdown menu, including like for like prices and those related to options, volatility levels and loan costs.
Choose the Axis Selection to either keep both tickers on a Primary axis or have one on a secondary axis, which you may need to do when comparing significantly different prices.
Click Apply when done.
My original ticker will display in whatever candle, line or bar format I had already selected, and the additional series will be displayed as a line.
If you want to compare both tickers as line charts, use the Time Period dropdown, follow the time period through to locate ‘line’.
Click Add Financial instrument icon again to request additional tickers by typing in the input field or remove them from the display by clicking the red ‘x’ button at the right of each line.
Compare to Index icon
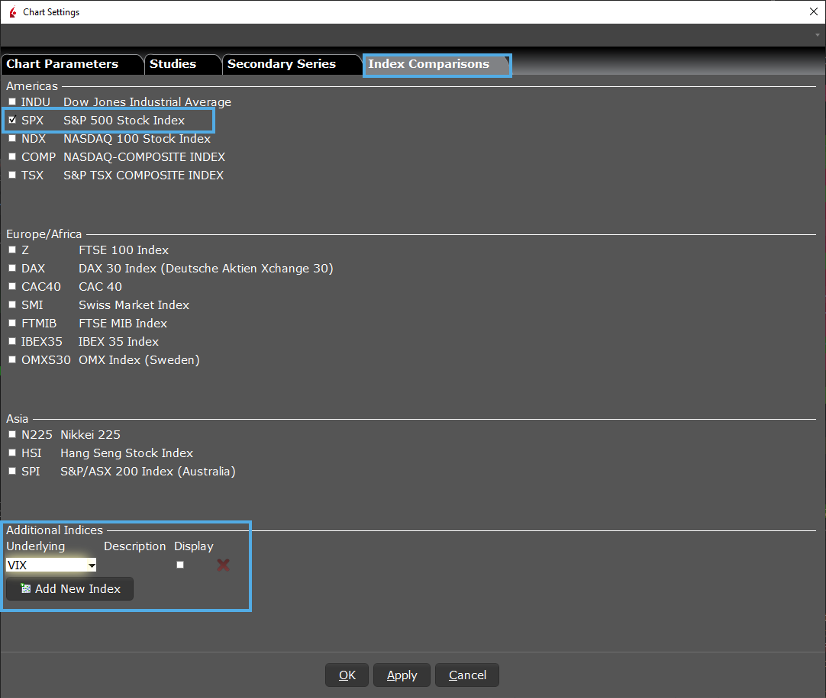
Let’s switch now to the Index Comparisons tab within Chart Settings.
Simply select any index you wish to compare your underlying to and click Apply.
The indices and the underlying will each begin at the same place on the left axis.
Although not displayed, the performance of an index relative to the underlying, is visually accurate and measured using percentage gain.
So, if the underlying and index under comparison have changed in price by the same percent over the duration of the selected time period, each will reach the right axis in the same place.
Where the stock has outpaced the benchmark index, for example, it will appear higher on the right axis in comparison to the index.
At the bottom of the Index Comparison tab, you may add alternative benchmarks for display. For example, let’s add the Vix index to this chart.
Add Study icon
TWS also has a long list of technical studies. Use the Add Study icon to quickly apply them from the chart’s Toolbar. Let’s add the study icon to the toolbar if it’s not already visible.
![]()
To the right of the Studies icon is a white dropdown arrow, which when selected, will list groups of studies by category.
When you hover your cursor over any of these categories, you’ll see an expanded list, and if you wish to see all studies using the tab format, click the See All Studies button at the bottom of the menu.
While the Studies tab follows the same category format, you can easily scour for all available fields using the search dialogue box. For example, I’ll type the word simple to narrow down all selections to find the Simple Moving Average.
Click on the selection you want to add to the chart and then click the Add button in the center column.
In this case, since I want to compare two simple averages, I’ll add the selection a second time.
Under the Applied Studies dialogue box, you’ll see that both studies use the same default nine period simple moving average.
To change the value for each – let’s say one to 10 period and the other to 50 period — just click each study one at a time and edit the length.
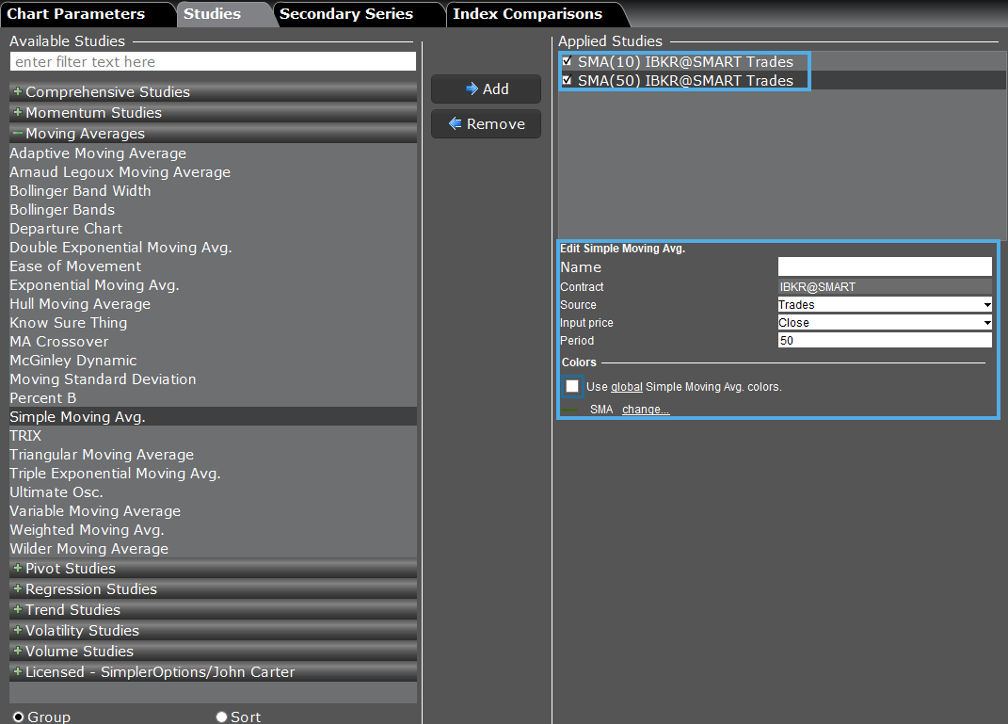
You may also create a name in this input field. Each study also has its own color assigned which can be changed.
When ready to add to your chart, click Apply or OK.
To remove a study from your chart, return to the Studies tab, highlight the unwanted series, and click Remove from the center column.
As you can see from the Toolbar configuration menu, there are many icons to choose from. As an investor, you should be able to quickly recognize which ones you will likely use most frequently. Several of these icons are self-explanatory, but let’s review a few more.
Annotate Charts
If you want to annotate a chart, use the Add Commentary icon, which when clicked opens a text dialog box.
Enter your message and click ok.
You can then click on the chart and drag the text box to where you’d like it to display.
Right-click to Edit – note the available choices here – select edit to reopen the dialog box, make changes to font size or color and click ok.
Then Remove Commentary icon, which when clicked immediately erases chart text.
Chart Zooming
For zooming in or out on a chart, use the two zoom icons.
To magnify a time frame, click the zoom in button to pick-up the magnifying glass, and left click-and-hold to highlight the period you wish to examine.
The chart then reflects only that period and will not necessarily show you the latest trading price. Simply click the zoom out icon to restore the chart to its original time period.
Show Bars Icon
With the Show Bars icon, you can quickly change your display in candlesticks to bars.
When displaying bars, the icon becomes a Show Candlesticks button, making it easier to toggle between the two display styles.
You can also sharpen the bar and candle display on a chart by using the Bar Width icons.
Let’s open configure tool bar again and add more icons to our chart. Let’s change the size of chart fonts and quote display fonts with Font Size, the Crosshair icon and the alert icon.
Adding Alerts
Use the Crosshair to pinpoint a specific price or time within the display.
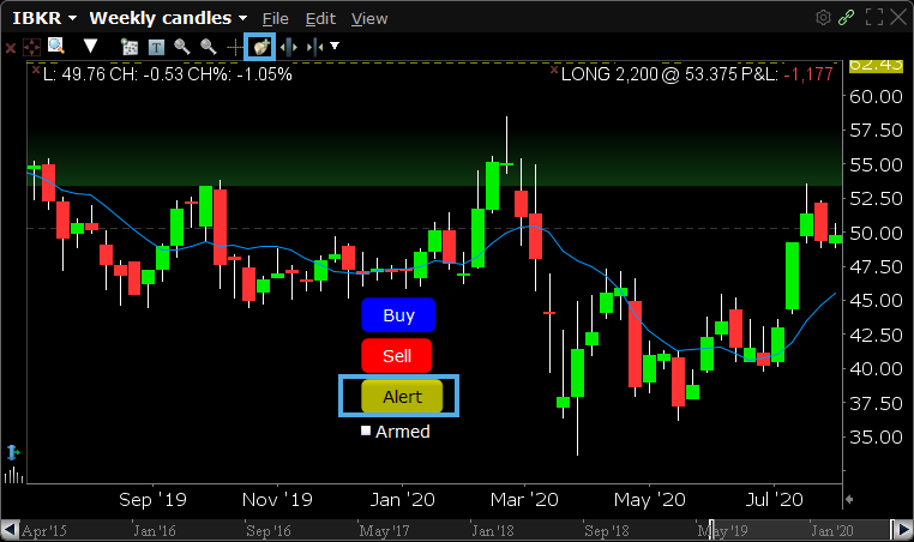
Let’s add an alert with the Alerts icon to be informed when a price reaches a specific level.
You can also add an alert by simply clicking the yellow Alert button too.
Use the crosshair to pinpoint where you want to set the alert on the chart.
Click the dropdown from the Method box and make a choice.
Then decide which Operator field to choose and then fine-tune the Price at which the Alert will be triggered, under the conditions you just specified.
Check the box if you want the Alert to be active outside of real time hours (RTH).
Then click Activate and see it display on the chart.
You should now have a good understanding about where to locate the Toolbar icons and how to configure them according to your charting needs.
You should also be able to navigate and apply the vast selections of icons that can be added to the toolbar to enhance your use of TWS charts.
Toolbar icons
![]()
Join The Conversation
If you have a general question, it may already be covered in our FAQs. If you have an account-specific question or concern, please reach out to Client Services.