


")


Study Notes:
The Monitor panel is likely going to be at the heart of your Trader Workstation activity. This panel can host several Watchlists to help you keep watch of multiple instruments and it contains a Tab to view your portfolio.
You will see that the monitor panel displays a default watchlist upon first opening.
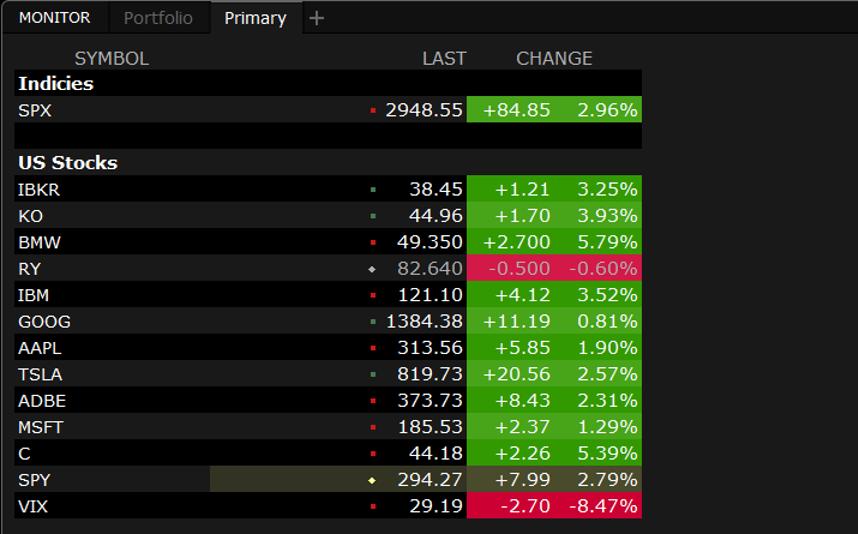
- The first column displays the financial instrument, followed by last price, change value and percentage change.
- You may move a symbol with a left-click and drag it down a row.
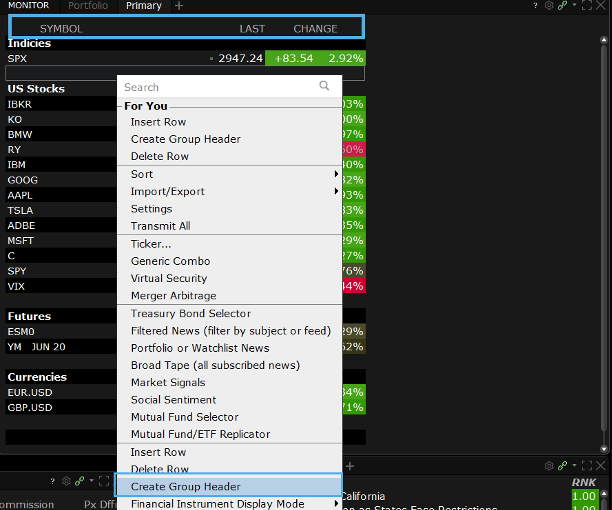
- To add a column-header for organization, right-click in the Financial Instrument column and select Create Group Header.
- Color is used to show the directional movement of the change values.
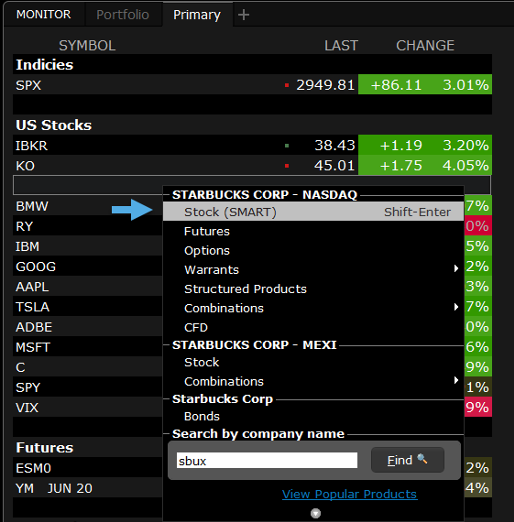
- You can add more symbols to this default watchlist, simply by entering a new symbol on a blank row and then selecting the asset type.
Adding Watchlist Tabs
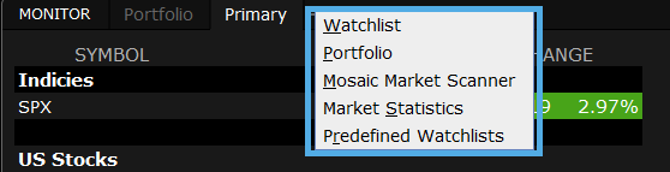
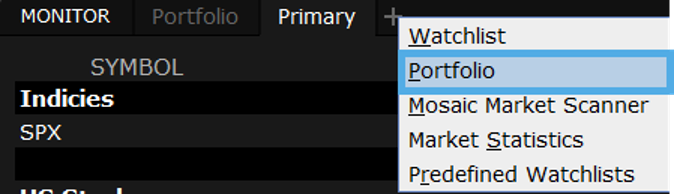
- Mosaic makes this easy to do, simply left click the plus sign and select the top item.
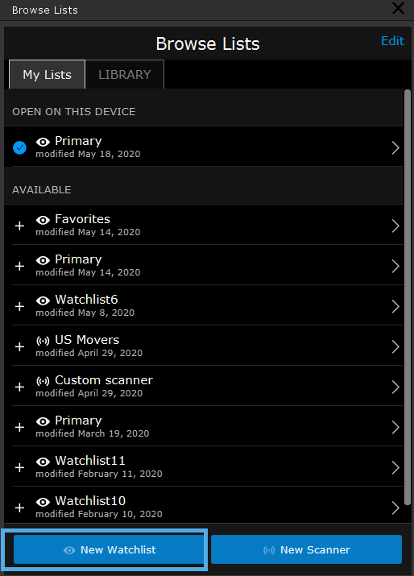
- You will see a sidecar window appear on the left. Two tabs appear at the top.
- My Lists which displays your watchlist on your device and previously saved available watchlist.
- Click on the watchlist in the available section to preview a list of instruments and choose whether or not you want to add the watchlist to the monitor panel.
- You can also decide to create an entirely new Watchlist.
- This will open a blank watchlist in the Monitor panel and add an additional tab.
- Next, type a symbol into the Financial Instrument column and make your asset selection. This is how you can add multiple instruments to your watchlist.
- Back to the plus sign next to the tabs, you will see Market Statistics, which displays key stats for NYSE, Nasdaq and AMEX exchanges. Here, you will see advancing and declining issues, as well as up and down volume.
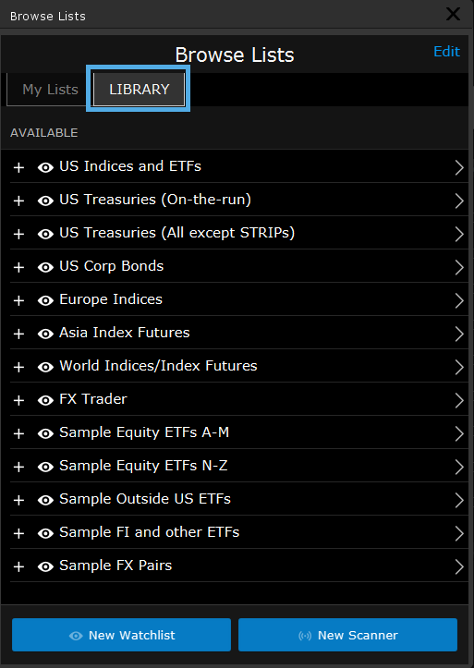
- You can also click Predefined Watchlists to browse a list of ready-made watchlists, select one to see more details and if the content is to your liking, you can use the Add button to create it as a new tab on your Monitor panel.
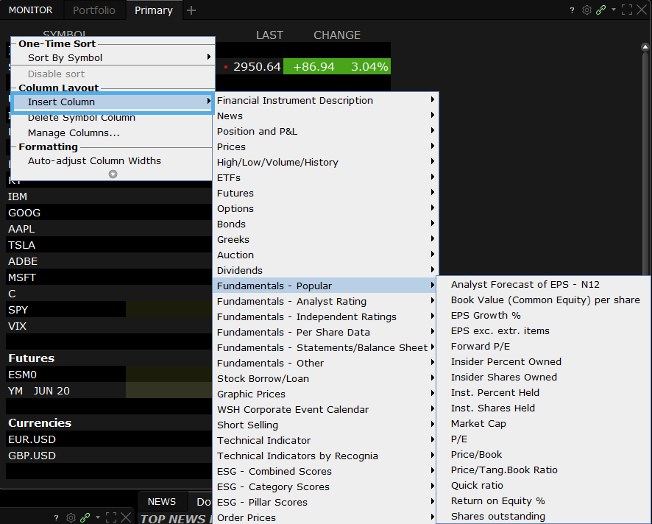
- The watchlist column display is completely configurable. Right-click any column header and select Insert Column, which displays a full set of categories to choose from, position and P&L, high/low and volume, popular fundamental values and more.
- In this case, let’s add the Company Name field from the Financial Instrument Description. When adding columns, you can also depress the right-click button and reposition it, if you want.
- Alternatively, use the gear icon and choose Settings to display the Configuration window.
- Here you can drill down into Available Columns to the right and add or remove them to the Shown Columns on the left under the Market Data Columns.
- Use the Colors tab to make changes to Text and Background display. Click Apply and OK when done.
- To rename a Watchlist, right-click on a tab and select Rename. Use the input field to rename and click OK.
Portfolio Tab
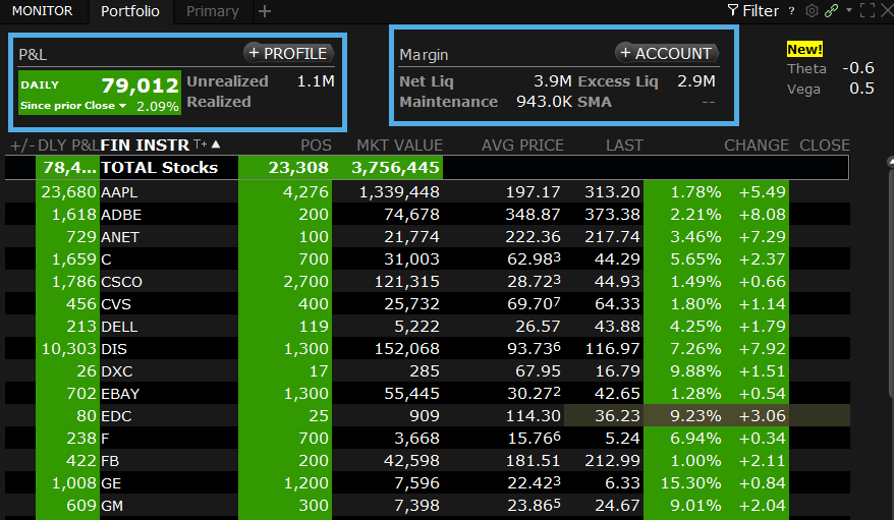
The Monitor panel also contains your Portfolio tab, which displays a snapshot of live positions, realized and unrealized P&L and current pricing.
- You can also see live daily P&L by base currency value in the upper left of the screen, with the unrealized value to its right, while your Margin requirements, net liquidation and excess liquidity also display to the right.
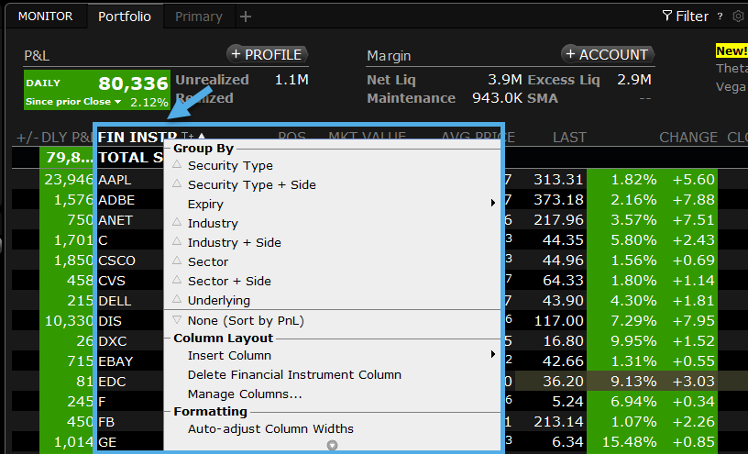
- Right click on the Financial Instrument column header to group positions in your portfolio according to Security type, expiry, sector, long or short.
- You can set the display according to alphabetical order or by ascending and descending P&L.
- Once you have decided how you want your display, click a column header to resort.
- You can use the Filter to isolate a symbol or security type. For example, you might need to filter by open options positions, which you can do by choosing options and then, when you close the filter, you’ll see a list comprised only of options in your portfolio. Open the Filter again to deselect the filter display.
- Use the gear icon and choose Settings to add or remove available columns to the displayed Market Data Columns. Click Apply and OK when done.
Performance Profile
- Towards the top of the Portfolio panel, you will see two buttons with plus symbols. These are shortcuts to a portfolio profile and to your account window. Click the plus symbol on the Profile button.
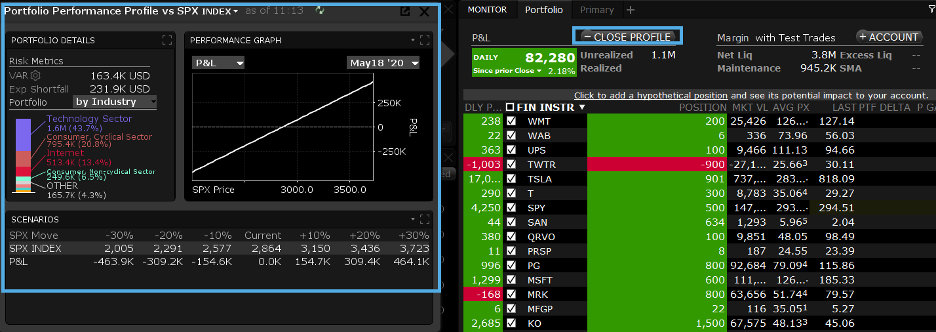
- Now you will see a window displaying Portfolio Details and risk metrics alongside a Performance Graph displaying expected P&L as the S&P 500 index rises and falls.
- You can see the scenarios displayed in the lower panel. Use the dropdown menus to view by either industry or asset class, P&L and Date display.
- Back on the portfolio, add a test trade to measure the impact on risk and profit and loss. Enter a symbol and quantity.
- Next – turn your attention back to the profile and view the impact of a plus and minus 10% movement in the S&P index on P&L.
- Now go back and check the box next to your test trades to see the incorporated impact.
- In this mode, you may also deselect existing portfolio positions by removing the checkmark, in order to compare the Performance Profile under changed circumstances.
- Click the X button in the Profile window to close the profile window.
Account Window
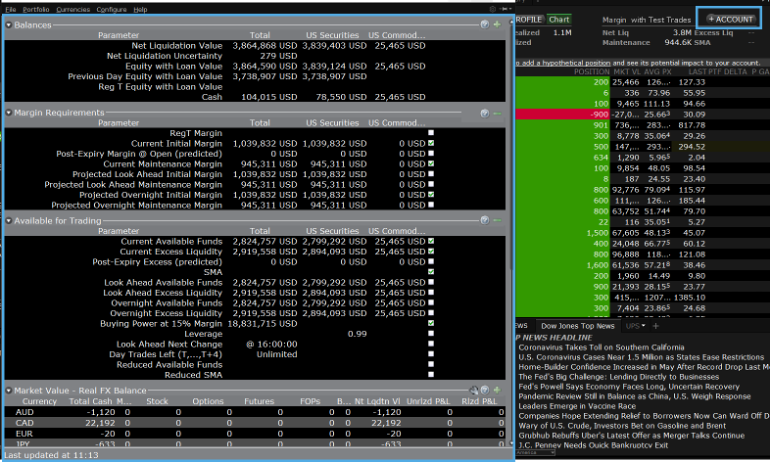
Lastly, to view your Balances, Margin Requirements, Funds Available for trading and Portfolio Positions, simply click the plus symbol on the Account button, and your Account Window will be displayed.
Could you have a broker contact me please
Thank you for reaching out, Johnny. We have various support options available such as phone and email. Our Client Service team will be happy to assist (http://spr.ly/IBKR_ClientServices). Additionally, you can review this tool on our website to learn more about the available methods for funding your account and/or transferring positions: http://spr.ly/IBKR_FundAccount. We hope you find this helpful!