


Study Notes:
The Monitor panel houses as many Watchlists as you want to build but is also home to the system-generated Portfolio page. This contains a real-time view of your overall account and can easily be configured. You can also see live P&L, liquidity and margin requirements at the top of the page.
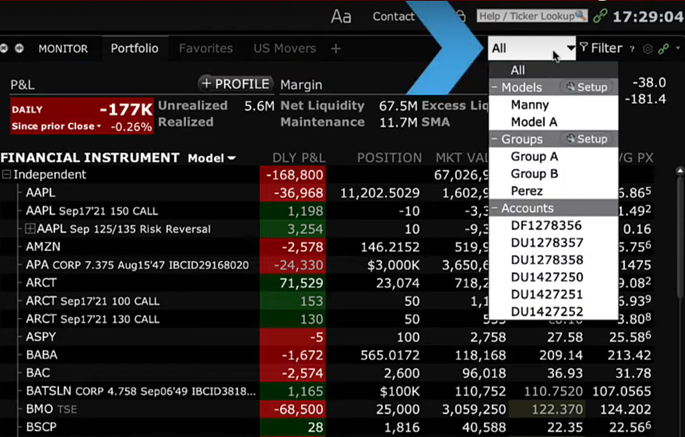
Use the Account Picker dropdown menu to select a single account, a Group of accounts or a Model Portfolio to isolate the display to that source.
The column display can be configured by right-clicking on any column header. Select Manage Columns and select data from the groups to the right and add them to the Shown columns in the middle. Click OK when done.
Right-click on the Financial Instrument column to choose the order in which you want to see the Portfolio page display. You may group the display by instrument, long, short, industry and sector.
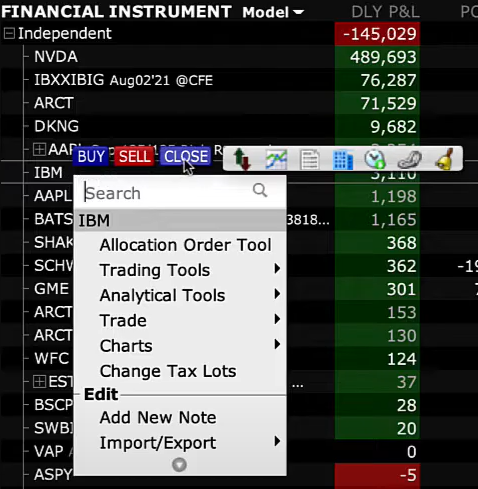
You can quickly close a position from the Portfolio tab.
You will notice that the Position value changes when interacting with the Account Picker. Note in the Position column the overall position is displayed when All is selected, while when choosing an individual account, the position value changes.
To close the position, determine whether to use one, a group or all accounts and then right-click on the symbol and you will see a floating pop-up menu containing Buy and Sell buttons. Click Close Position.
Note that in the Order Entry panel, the background turns red to denote the sale of the position, while the quantity field also matches the position size. Change the order type and price as necessary and click submit to create an order confirmation page. Click Transmit when ready.
At the top right of the Portfolio tab is an Account button, which is a shortcut to the Account Window. You can also access the same from the Account menu in the upper left of the screen, where you can also log in to the Account Management home area, also known as Advisor Portal.
Click on the Account button on the Portfolio tab. You will notice two tabs – one for Account and one for a Summary view. You will also notice that at the top left is an Account Picker dropdown menu. Here you may isolate a single account, a group of accounts or those accounts invested in a specific Model.
On the Account tab, there are six data views, and to the left is an arrow to expand and contract that view. Those different views are Balances, Margin Requirements, Funds Available for Trading, Real and Virtual FX positions and finally the Portfolio view.
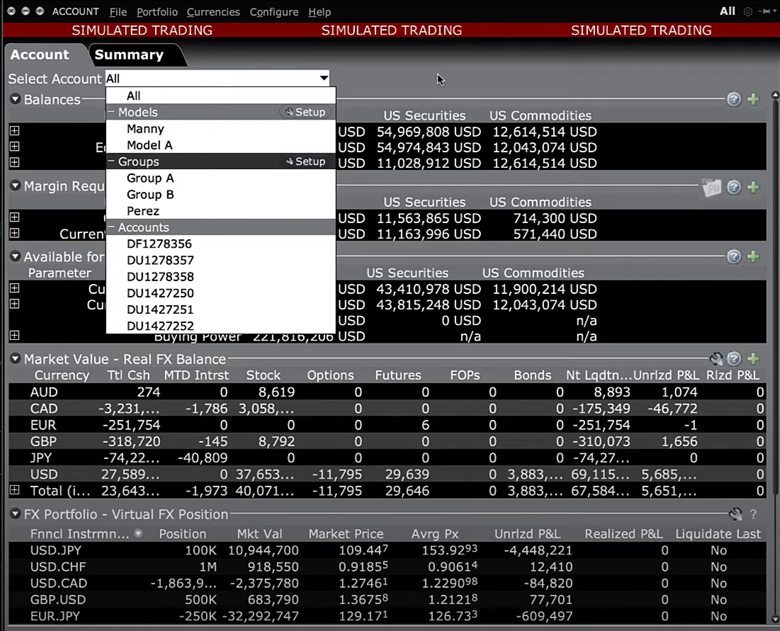
The Summary tab displays Balances by account above and Market Value for each account below. Under the Balances area you will see the account number and account type of each of your client’s accounts.
And you will see two columns displayed for NLV – one for Stocks and one for Commodities. The sum of the two is displayed in the Net Liquidation Value column.
The Buying Power of each account is displayed and is determined by account type. Finally, the percentage of Excess liquidity in Stocks and Commodities accounts is combined in the far-right column.
Below in the Market Value area, you can see Cash positions available along with the real-time value of open positions across different asset classes displayed. Here you can also see unrealized P&L values associated with each account.
There is a lot of possible information and fields that an Advisor can add to the Portfolio tab to help make their lives easier. Don’t forget to use the shortcut button to the Account window to quickly look-up clients’ buying power and available balances.
My close button is missing when I had it before. What happened? How can I restore this?
Hello Ash, we hope the problem has been resolved. If not, please call or create a web ticket for Client Services. Client Services can also assist in closing positions if necessary. http://spr.ly/IBKR_ClientServices